
Figure 4.
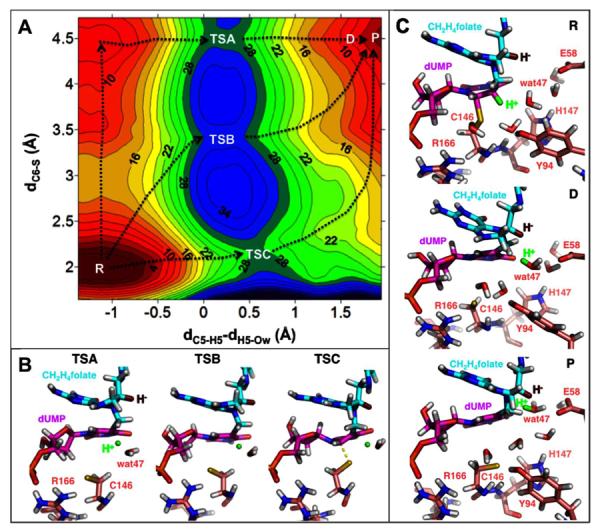
(A) The 2D-PMF calculation used the C6-S bond distance (dC6-S, vertical axis) and the antisymmetric combination describing the C-→O proton transfer (dC5-H5 - dH5-Ow, horizontal axis) as the DRC. There are various reaction paths (exemplified by the black dotted lines) with three TSs for the proton transfer (labeled as TSA, TSB, and TSC on the plot). TSA, TSB, and TSC have similar free energies (28, 30, and 28 kcal/mol, respectively) relative to the reactant state (R). The C6-S bond is fully broken (4.5 Å) in the product state (P), suggesting a reaction intermediate where the ligands are not covalently attached to the protein. (B) Representative structures for the three TSs revealed by this 2D-PMF. Only residues R166 and C146 are shown for the protein for clarity. R166 forms a strong H-bond (2.1 Å, Table S1) with C146 to stabilize the S anion in TSA and TSB. The transferred proton is in green and the hydride to be transferred (in step 5 of Scheme 2) is in dark red. (C) Representative structures for the R and P states, and a representative structure (D) along the reaction path. H5 has been transferred to wat47 in D (see the H5-Ow distance in Table S1), however, the system does not reach energy minimum (P) until the protonated wat47 moves to an optimal position that is ready to protonate N5F (the next step). This process is accompanied by rearrangement of the H-bond network that not only relocates wat47 but also destabilizes the S anion, making the active site favorable for the subsequent chemical steps (see text). Only the protein residues discussed in the text are shown for clarity. Table S1 in SI provides structural analyses of the six states labeled in this figure.