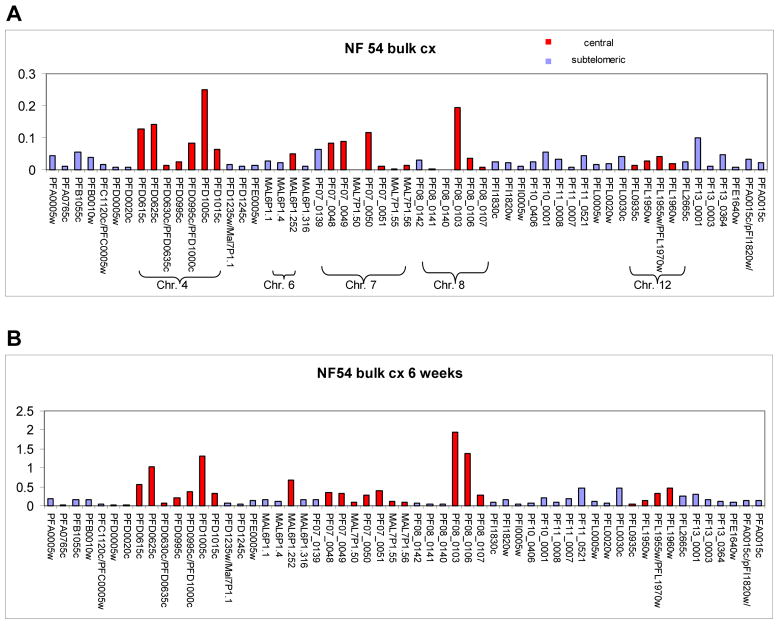
Figure 1. Transcriptional analysis of bulk NF54 cultures by quantitative RT-PCR. Panel A.
Transcriptional analysis of an unselected NF 54 bulk culture. var genes located in central and subtelomeric regions of P.falciparum chromosomes are colored in red and blue respectively. The expression pattern of the var gene family favors expression of central var genes. Panel B. Transcriptional analysis of the same culture after 6 weeks of unselected growth. The var gene expression pattern of the parasite population continues to favor expression of central var genes.

