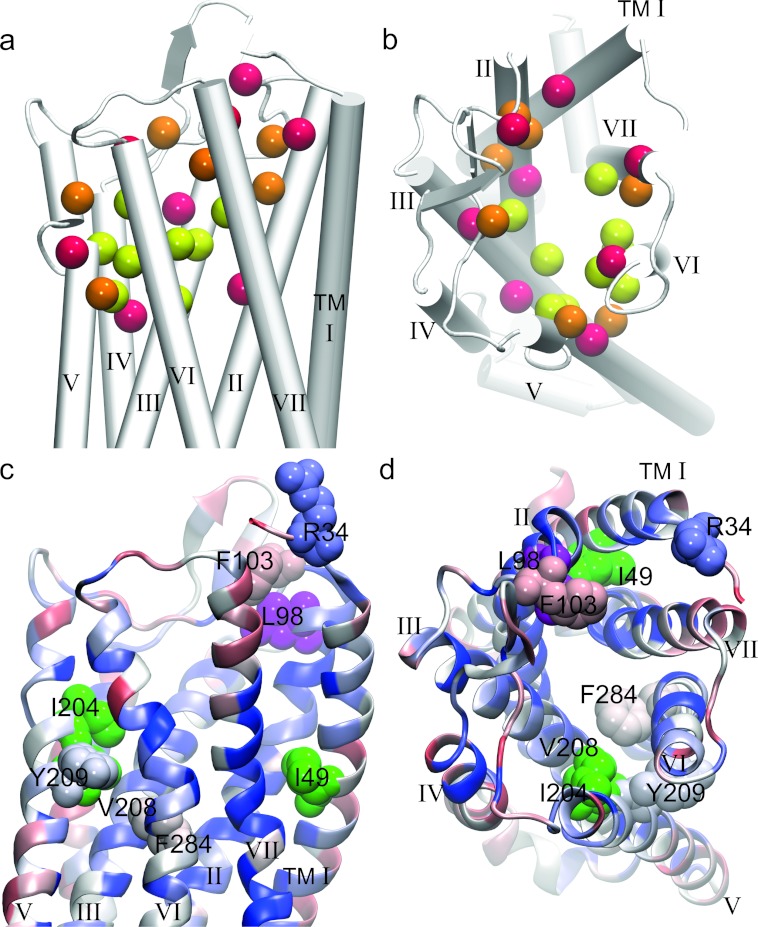
Figure 3. Mapping of GPCR ligand-binding sites on to the structural model of the human OTR.
Sequences of the OTR and the opioid receptor were aligned with muscle [34] and a model of the human OTR was built using MODELLER v9.8 [35] applying the automodel procedure, of the mouse μ-opioid receptor crystal structure as a template (PDB ID: 4DKL) [21]. (a and b) Residues that interact with GPCR ligands have been extracted from crystal structures and are listed in Supplementary Table 1 at http://www.biochemsoctrans.org/bst/041/bst0410197add.htm. The residues that interact with a GPCR ligand have been mapped on to the homology model of the human OTR. The β-carbon atoms of these residues are shown as van der Waals spheres. Colour coding highlights interaction frequency: yellow, >75%, orange, 25–75% and red, <25%. Residues displaying high interaction frequency line the surface of the binding pocket. (c and d) Residue conservation of OTRs: per residue sequence conservation of OT sequences, analysed by sequence alignment, are visualized in the framework of the three-dimensional structure of the OTR model. The yellow spheres show the β-carbon atoms of the residues interacting with ligand. The colour-coding of the OTR model highlights the per residue conservation ranging from dark blue (identical) to red (opposite type of amino acid). Conservation analysis was carried out using ClustalW. The four residues (Arg34, Phe103, Tyr209 and Phe284) of the OTR known to affect binding of the native ligands are shown in space filling. Sequences excluded from the similarity analysis owing to incompletion are: G3US67, G5BX96, G3H112 and B5UA19. The following structures were used for the interaction analysis: 2RH1, 2Y00, 2Y04, 3D4S, 3EML, 3OAX, 3OE6, 3PBL, 3SN6, 3UON, 3V2Y, 4DAJ, 4DJH, 4DKL, 4EA3, 4EJ4, 2VT4, 3P0G, 3PDS, 3PWH, 3RZ4 and 3V2W. TM α-helices are shown as grey cylinders or helix cartoons and are labelled from TMI–VII. Residues that correlate with the respective ligand sequence (i.e. Ile49, Leu98, Ile204 and Val208; numbering according to human OTR) are shown in magenta and green respectively.

