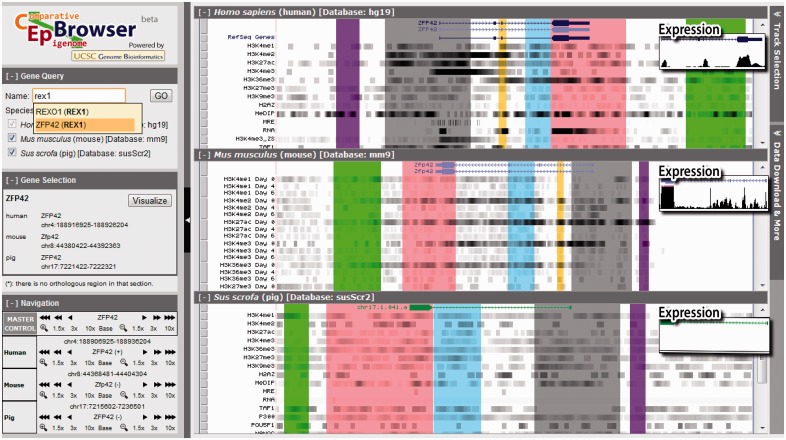
Fig. 1.
The multi-species alignment track. The main visualization area is split into three vertical panels, showing the genomes and epigenomes of humans, mice, and pigs. The top panel displays a human genomic region near the ZFP42 gene. Unfiltered sequencing data from ChIP-seq and other technologies are shown in epigenomic tracks (H3K4me1 etc.) in dense view in grayscale. The darkness reflects the number of overlapping sequencing reads at a genomic location. The middle and lower panels show the epigenomic data on comparable genomic regions in mice and pigs. Orthologous sequences are marked by the same color. These color-coded blocks clarify what epigenomic data are on orthologous sequences and thus comparable. On the left are three auxiliary panels for searching genes, selecting and navigating genomic regions, and controlling the synchronization of navigation (Master control). On the right is the button to call out the Track Selection Panel (hidden), which controls the track display and synchronization. The expression tracks show the RNA-seq data in the full view (inserts)

