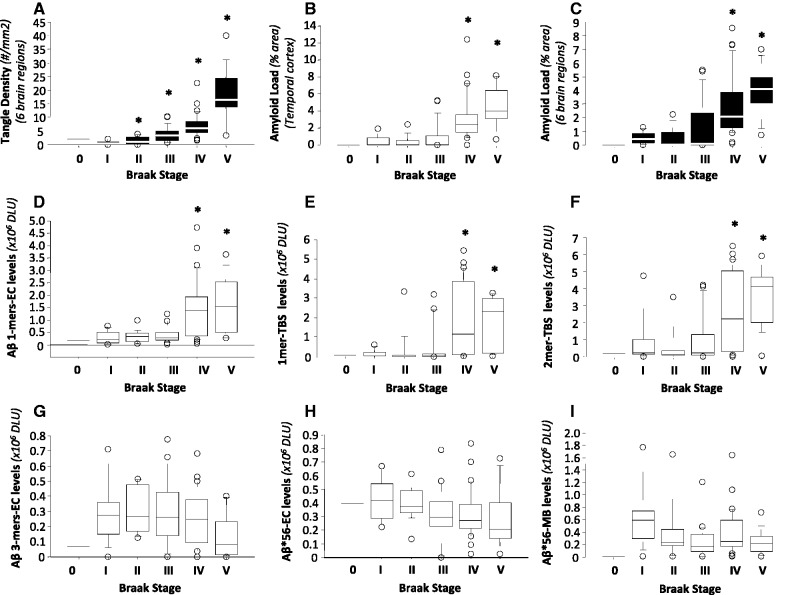
Figure 8.
Relationships between specific amyloid-β oligomers in the brain and Braak stages. (A–C) The relationships between Braak stages and neurofibrillary tangle density (A), amyloid load in temporal cortex (B) and average amyloid load in six brain regions (C). (D–I) The relationships between Braak stages and the levels of various amyloid-β species, including amyloid-β monomers in extracellular (EC)-enriched fractions (D) and Tris-buffered saline (TBS) extracts (E), amyloid-β dimers in Tris-buffered saline extracts (F), amyloid-β trimers in extracellular-enriched fractions (G), and Aβ*56 in extracellular-enriched (H) and membrane (MB)-enriched (I) fractions. *P < 0.01; each of Braak stages II to V is compared with Braak stage I using Kruskal-Wallis test followed by Mann-Whitney U test with Bonferroni corrections. DLU = densitometry light units.

