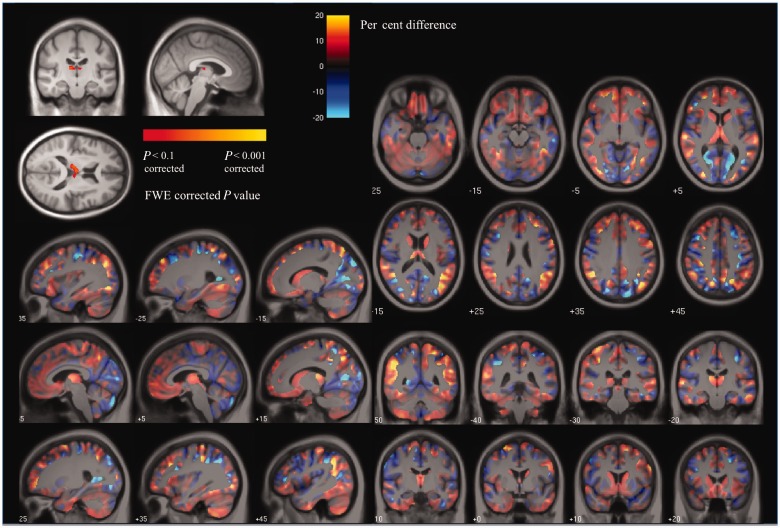
Figure 3.
Voxel-based morphometry results showing (top left) areas of grey matter reduction in presymptomatic mutation carriers compared with control subjects after correction for multiple comparisons at FWE < 0.1 and the effect-map for the PMC versus control group comparison. In the effect-map, regions showing reduced grey matter in the PMC group are shown in red and in control subjects in blue. Differences between the two adjusted group-means are overlaid on a mean study-specific template. Images shown in radiological convention (right on left).

