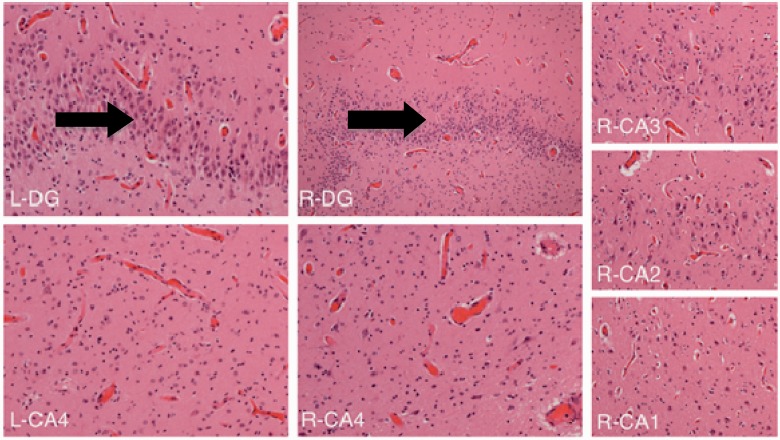
Figure 6.
Hippocampal sections from Patient 12 revealing a pattern of hippocampal sclerosis. Right and left CA4 sectors show depletion of neurons and gliosis (i.e. end folial sclerosis). R-DG (right dentate gyrus) and L-DG (left dentate gyrus) show an extra layer of cells (arrow) due to granule cell dispersion. Right CA3/CA2/CA1 are relatively preserved.

