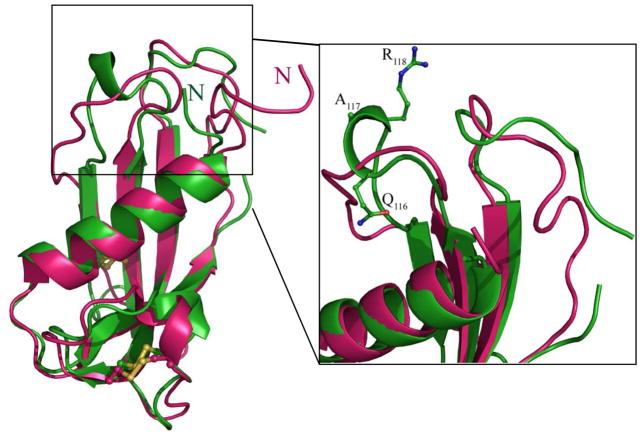
Figure 3.
Comparison of the crystal structure of hCLD and the solution structure of ProS. Left panel: Superposition of Ca ribbon diagrams of hCLD (green) and ProS (pink) Right panel: 90° rotated close-up view of the L1 and L2 loop regions. Disulfide bonds and residues of hCLD involved in a hydrogen-bonded turn are shown as balls and sticks.

