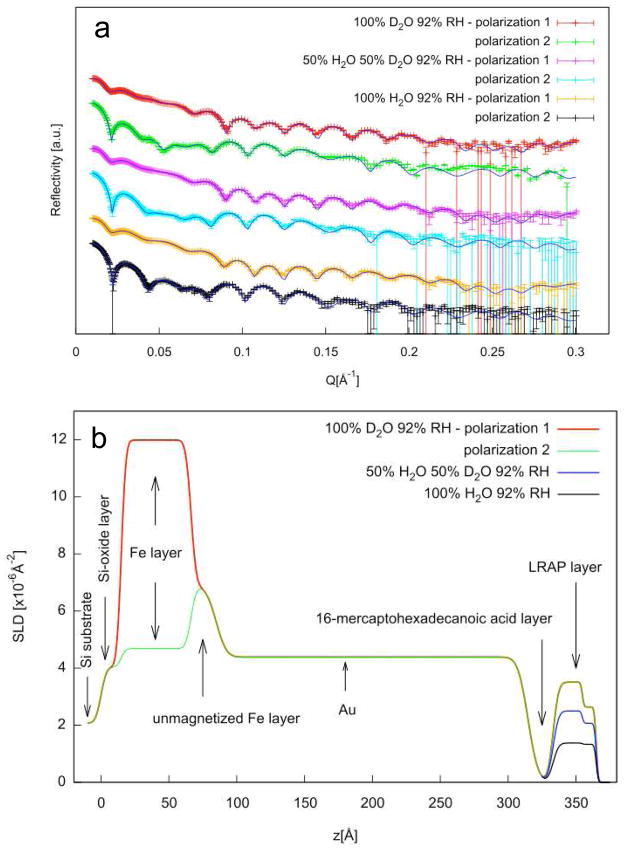
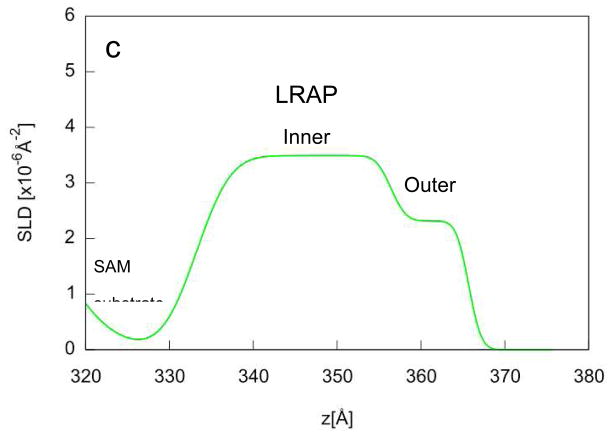
Figure 6.
a) reflectivity data (symbols) and corresponding fits (lines) for LRAP adsorbed from SCP solutions under three humid atmosphere conditions (92% RH 100% D20, 50% H2O:50% D2O, 100% H2O). The fits are the calculated reflectivities corresponding to the SLD profiles in Figure 6b. b) SLD profiles obtained from simultaneous fitting of reflectivity data using the two layer protein model to the total SLD. c) Expanded view of the SLD profile of the LRAP layer in 100% D2O humid atmosphere.


