
Figure 2. Line graph demonstrating the relationship between renal sinus fat, number of antihypertensive medications and control of blood pressure.
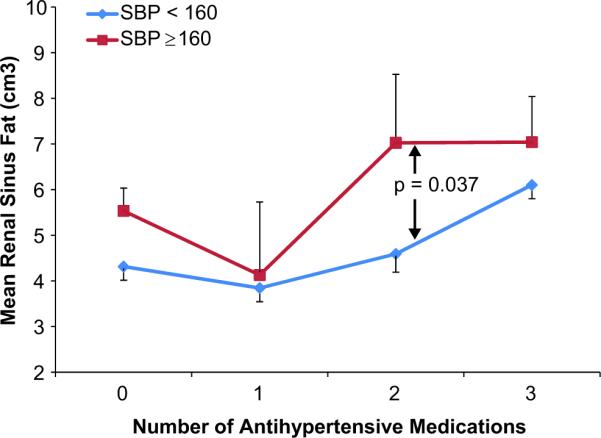
Line graph showing amount of renal sinus (RS) fat on the y-axis and number of antihypertensive medications (0–3) on the x-axis for those with (red) and without (blue) stage II hypertension (a systolic blood pressure [SBP] ≥ or < 160mmHg). For all participants, renal sinus fat was greater in those with a SBP ≥ as opposed to < 160mmHg.