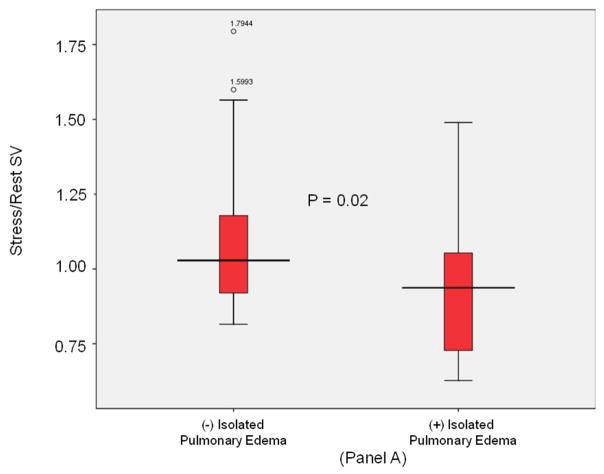
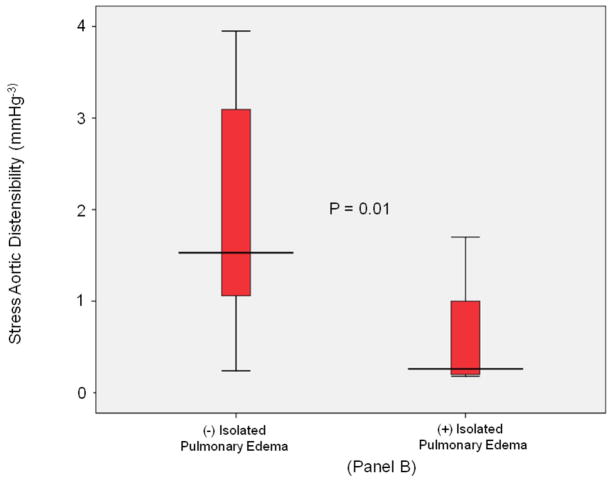
Figure 3. LV stroke volume and aortic stiffness (isolated pulmonary edema).
Box-and-whisker plots of stress/rest left ventricular stroke volume (y-axis, Panel A) and peak stress aortic distensibility (y-axis, Panel B) measured during dobutamine cardiovascular magnetic resonance imaging. Pulmonary edema- and pulmonary edema+ groups are shown on the x-axis. In participants with isolated pulmonary edema and no inducible left ventricular motion abnormalities indicative of ischemia during dobutamine, LVSV reserve was reduced and stress induced aortic distensibility was elevated relative to control subjects. In these plots, lines within boxes represent median values; the top and bottom lines of the boxes represent the 25th and 75th percentiles, respectively; the top and bottom whiskers outside the boxes represent the smallest data value that is ≥ Q1- 1.5 (IQR) and the largest data value that is ≤ Q3+1.5 (IQR), respectively.


