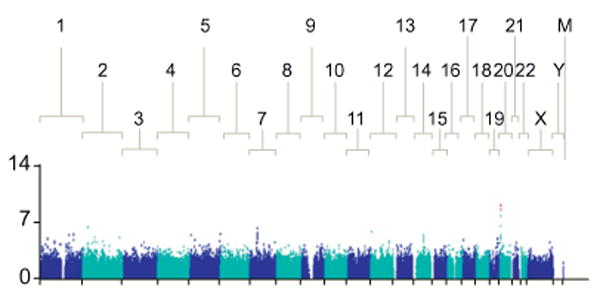
Fig. 1. The Manhattan plot shows a genome-wide view of the p values [2log10(P)] for association between SNPs tested and week 4 platelet reduction in patients of European American ancestry.

The SNPs that show genome-wide significant association with quantitative reduction in Pl levels are marked in red. [This figure appears in color on the web.]
