
Fig. 2.
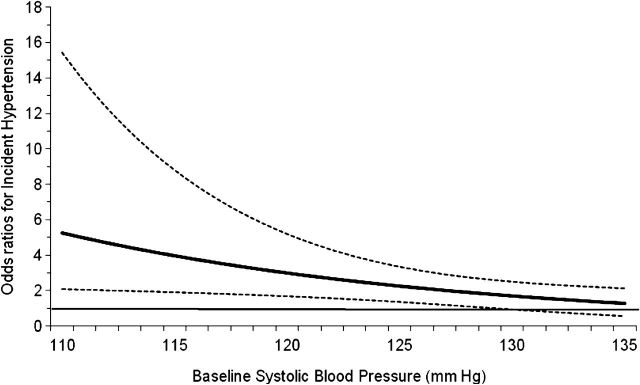
Relationship between high normal versus lower levels of albumin to creatinine ratio (UACR) and baseline SBP on incident hypertension. The solid horizontal line (––) at odds ratio of 1.0 indicates no difference between the participants with UACR < and >4 mg/g at various levels of baseline SBP. The solid (——) and dotted (… …) curved lines represent point estimates and 95% CIs for odds ratios. P-value for test of interaction between baseline SBP and UACR was 0.016.