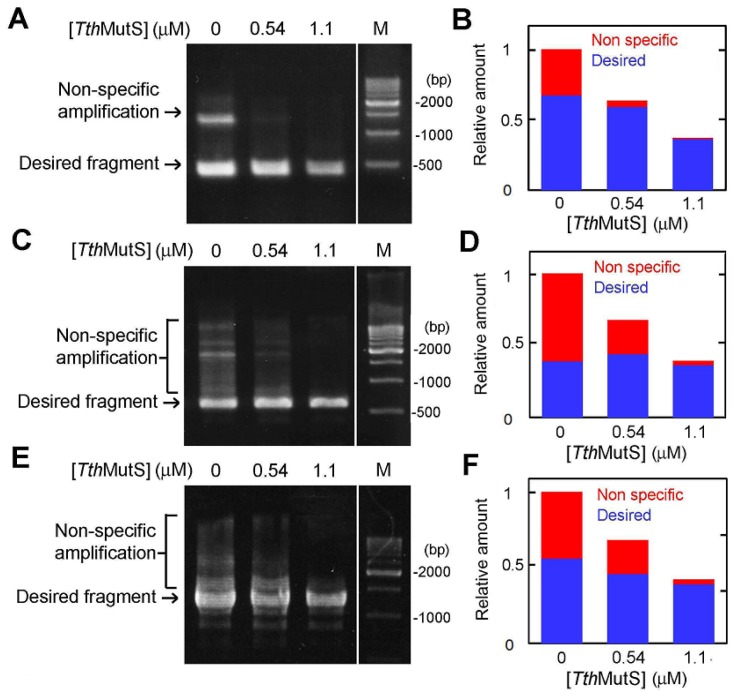
Figure 6.
Effects of MutS on gene amplification from genomic DNA. (A) A 423-bp region of ttha1806 of T. thermophilus was amplified in the presence of TthMutS. The 500-bp DNA ladder is indicated by the lane marked “M”. A second aliquot of TthMutS was added to the reaction at the end of the fifteenth cycle. The final concentration of TthMutS is shown at the top of the lanes; (B) The relative amounts of nonspecific and desired amplification products from (A) are shown in red and blue, respectively; (C) Amplification of the 594-bp region of tthb071 in the presence of TthMutS; (D) Quantification of the amplification products from (C); (E) The 1278-bp region of ttha1548 was amplified; (F) Quantification of the amplification products shown in (E). The amounts of the products were normalized by the amount of total products at 0 μM TthMutS.

