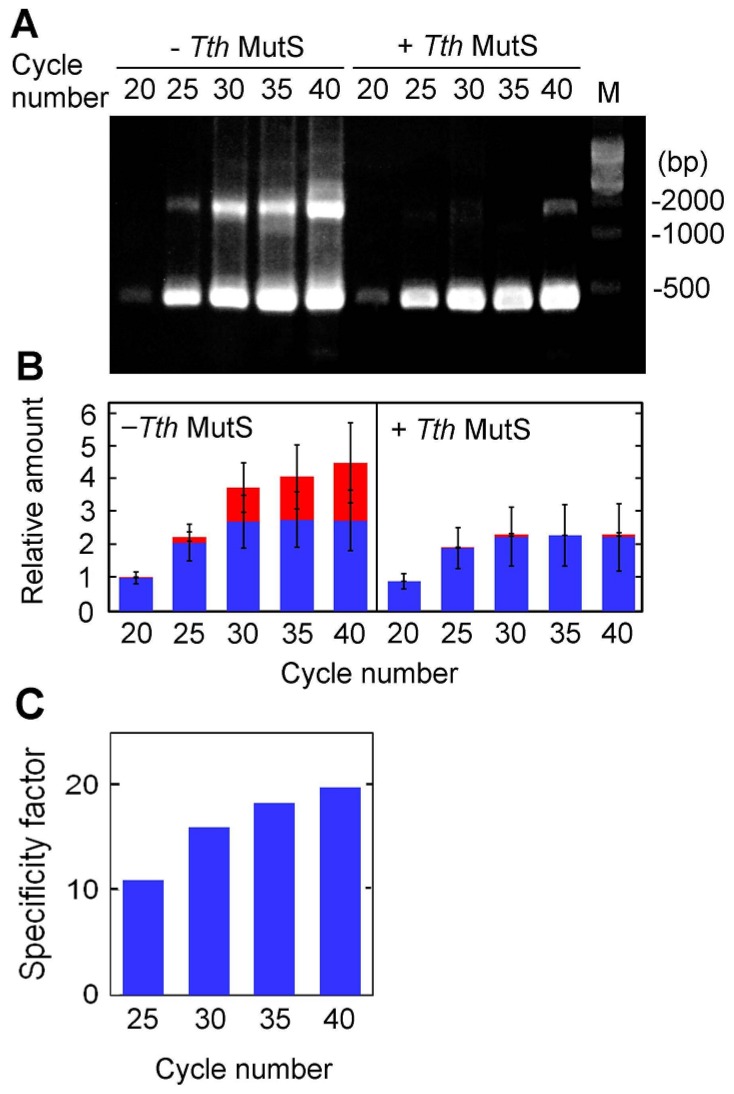
Figure 7.
PCR cycle-dependence of the amplification of a 423-bp region of ttha1806. (A) The amplification was performed in the presence or absence in 1.1 μM TthMutS and it was terminated at the end of 20, 25, 30, 35 or 40 PCR cycles. The 500-bp DNA ladder is indicated by the lane marked “M”; (B) The relative amounts of nonspecific and desired amplification products from (A) are shown in red and blue, respectively. The experiments were performed three times. Bars indicate standard deviations. The amounts of the products were normalized by the amount of total products at the end of twentieth cycle in the absence of TthMutS; (C) Specificity factor for 1.1 μM TthMutS at each PCR cycle.

