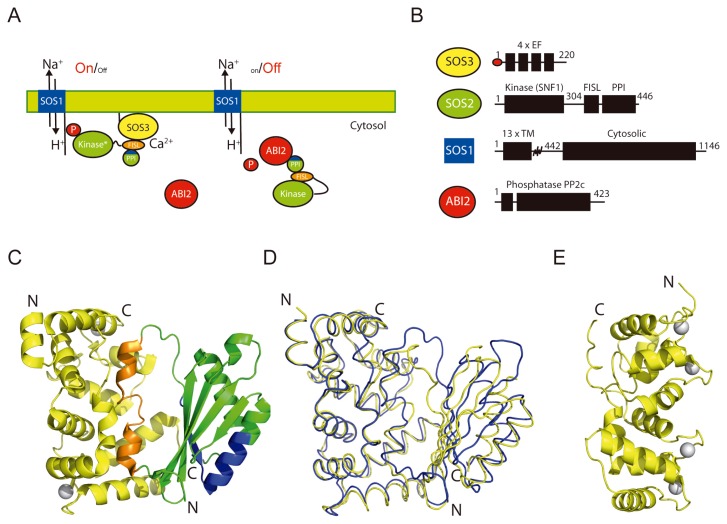
Figure 1.
The SOS pathway is illustrative of the CBL-CIPK-PP2C network. (A) A schematic representation of the pathway function. (B) Domain structure of the protein components. (C) A ribbon representation of the structure of SOS3 in complex with the C-terminal regulatory domain of SOS2 and Ca2+. SOS3 is displayed in yellow, the FISL motif is displayed in orange, the PPI motif is displayed in blue, and the rest of the PPI domain of SOS2 is displayed in green. Calcium atoms are displayed as grey spheres. (C) The superimposition of the ribbon diagrams corresponding to the structures of the SOS3-SOS2, in blue, and CBL2-CIPK14 in yellow. (D) The structure of SOS3 in complex with Ca2+.

