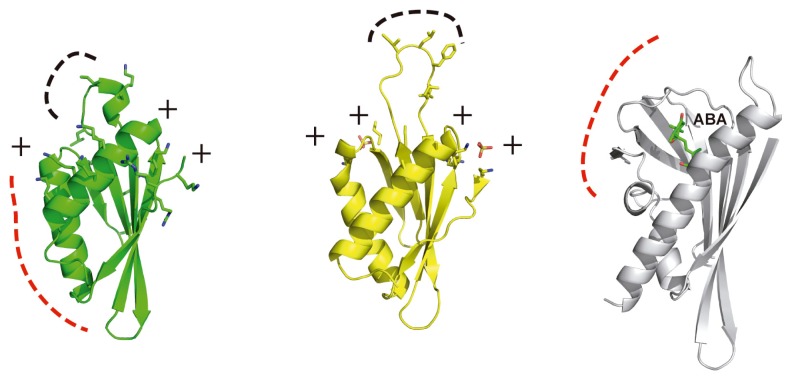
Figure 3.
Structural comparison of SOS2 PPI domain (left) with the related structures of the KA1 lipid binding domain (middle) and PYL/PYL ABA receptors (right). Lys and Arg, as well as accessible hydrophobic residues are displayed in stick mode. The hydrophobic loop and the PP2C binding interaction area are highlighted as a black and red dashed line, respectively.

