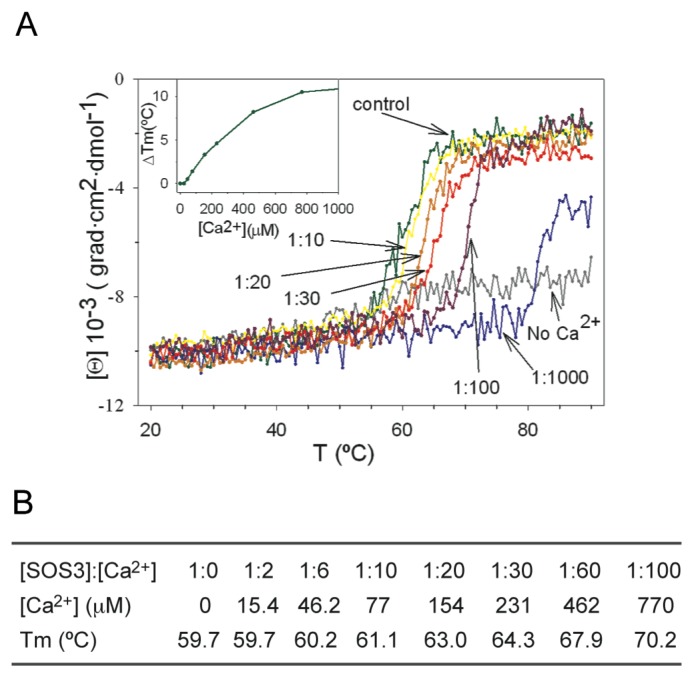
Figure 6.
The Ca2+ affinity of SOS3. (A) Circular dichroism denaturation profiles of SOS3 as a function of Ca2+ concentrations. The SOS3: Ca2+ ratio ([SOS3]:[Ca2+]) is the molar ratio between protein and Ca2+ in the solution. Data are referred to [SOS3] = 7.7106 M. EDTA-dialyzed protein sample is labeled as “No Ca2+”. Inset and (B): Variation of the Tm (Δ Tm = Tm for a given concentration menus Tm of the control sample) with respect to the Ca2+ concentration.

