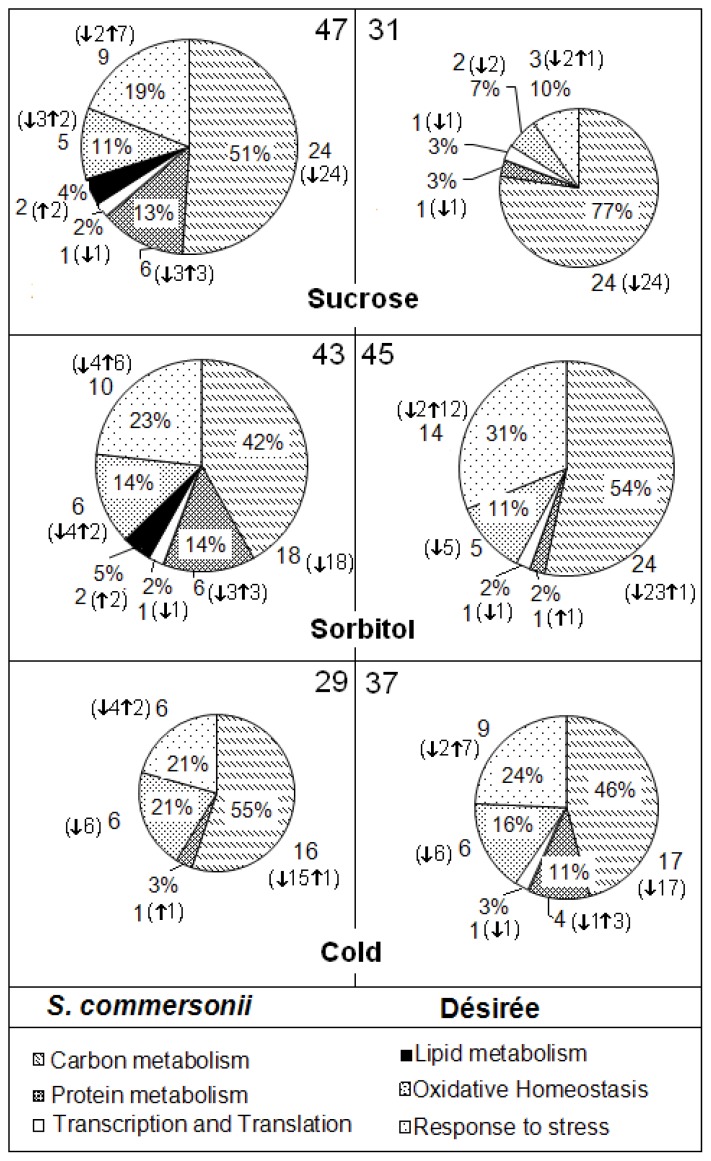
Figure 5.
Distribution of identified proteins differentially expressed under the different stress conditions studied. The numbers represent the number of identified proteins that significantly change in abundance in S. commersonii (left) and S. tuberosum cv. Désirée (right); between brackets are represented the number of proteins that are significantly increased (↑) or decreased (↓) in abundance. Classification of proteins was done based on the GO annotation from Goanna [33].

