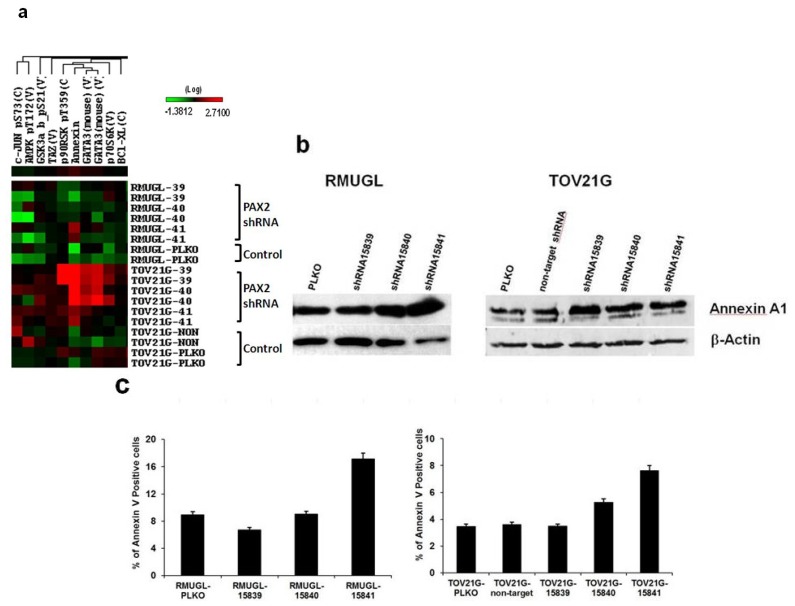
Figure 4.
Up-regulation of Annexin A1 and increase in apoptotic cells in PAX2 knockdown cell lines. (a) Reverse phase protein array (RPPA) analysis showed PAX2 knockdown ovarian cancer cell lines had a higher expression of Annexin A1 than control cells; (b) Western blot analysis was used to measure Annexin A1 expression in RMUGL and TOV21G ovarian cancer cell lines with or without PAX2 knockdown; (c) Flow cytometric analysis of percentage of apoptotic cells using APC-Annexin V staining.

