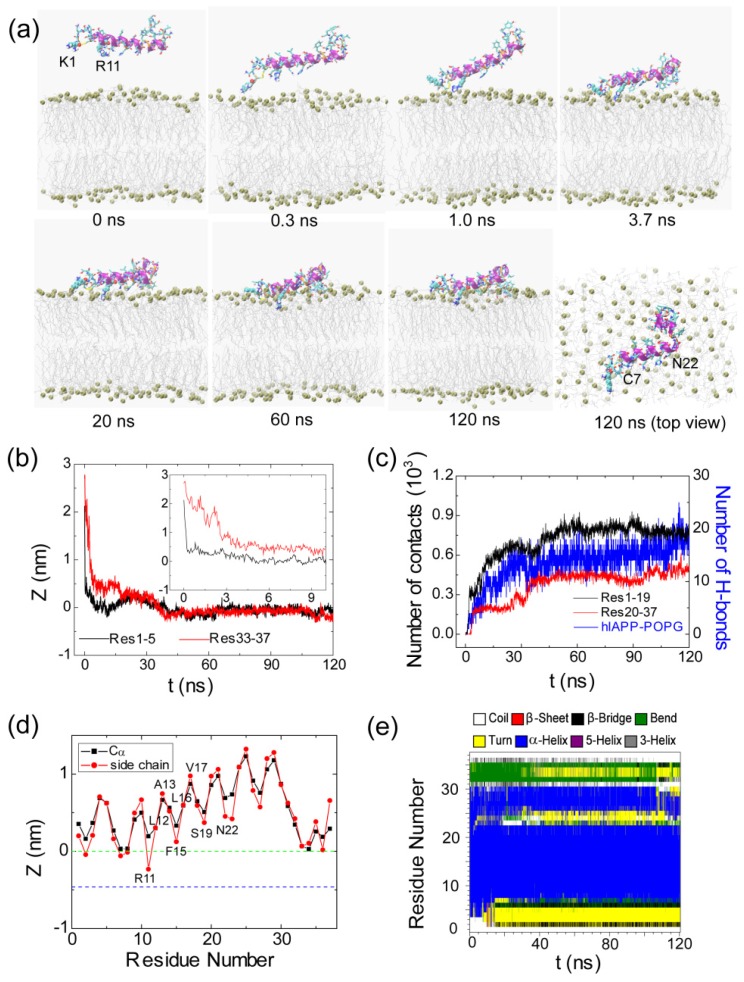
Figure 4.
Detailed analysis of a representative MD trajectory starting from initial state S3(180). (a) Snapshots at seven different time points and the top view of the snapshot at t = 120 ns. Each snapshot is displayed using the same representations as those used in Figure 1; (b) Time evolution of the minimum distance between the N-/C-terminus of hIAPP and the lipid bilayer. In order to show clearly the initial adsorption process, we give the time evolution of the distance within the first 10 ns in the inset; (c) Time evolution of the number of contacts between N-/C-terminal residues 1–19/20–37 (Res1–19/Res20–37) and the POPG bilayer and the number of hydrogen bonds formed between hIAPP and POPG lipids; (d) The time-averaged (last 20 ns) z-positions of the Cα atom (blue) and the side chain centroid (red) as a function of residue number. The dotted green and blue lines correspond to the headgroup phosphorus atom and the first carbon atom in the lipid tail of the sn-1 chain, respectively; (e) The secondary structure profile of hIAPP.

