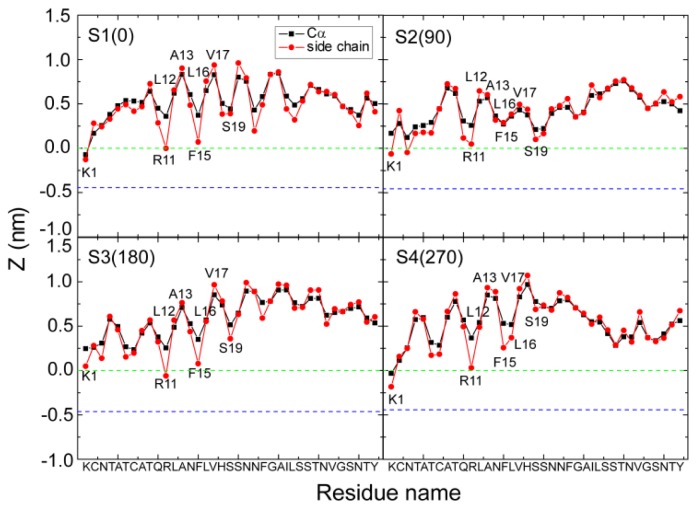
Figure 5.
The z-positions of the Cα atom (blue) and the side chain centroid (red) of each residue. The results are for four different systems, S1(0), S2(90), S3(180) and S4(270). For each system, the z-position is an average of three different MD runs using the last 20 ns data. The dotted green and blue lines correspond respectively to the headgroup phosphorus atom and the first carbon atom in the lipid tail of the sn-1 chain. The region between the two lines is the headgroup region of the POPG bilayer. We observe that simulations with different starting orientations of the peptides relative to the bilayer surface lead to a similar binding orientation, with residues R11, F15 and S19 oriented toward the POPG bilayer surface.

