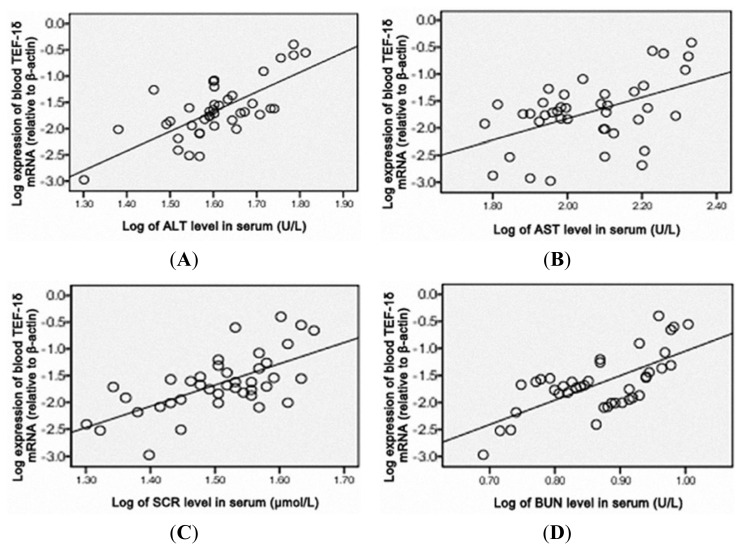
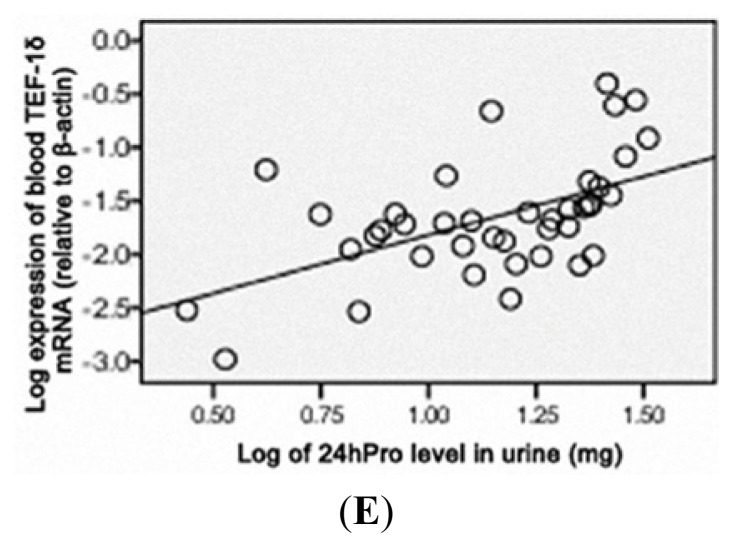
Figure 5.
Correlation analysis between the blood TEF-1δ expression and ALT (A), AST (B), SCR (C), BUN (D) and 24hPro (E) levels in cadmium-exposed rats. Blood TEF-1δ expression level showed positively correlation to ALT (r = 0.663, P < 0.01), AST (r = 0.590, P < 0.01), SCR (r = 0.648, P < 0.01), BUN (r = 0.583, P < 0.01) and 24hPro (r = 0.543, P < 0.01). ALT, serum alanine aminotransferase. AST, aspartate aminotransferase. BUN, blood urea nitrogen. SCR, serum creatinine. 24hPro, 24-h urine protein.


