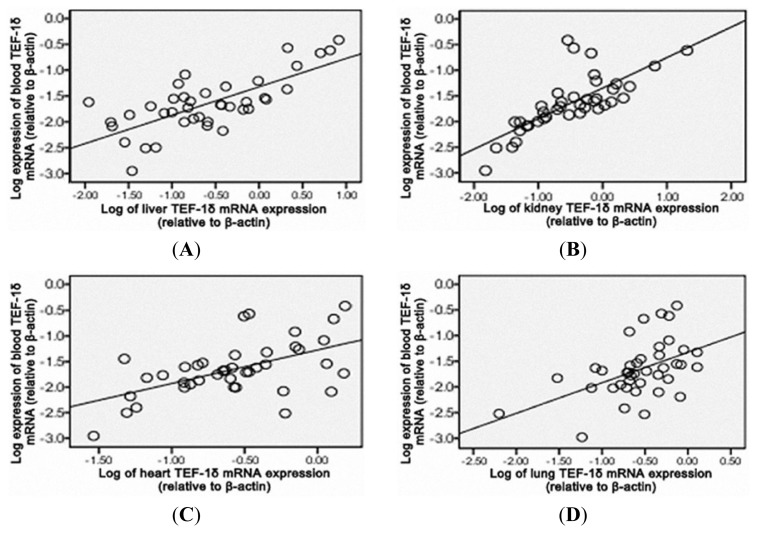
Figure 6.
Pearson or spearman’s correlation analysis of TEF-1δ expression levels between the blood and liver (A), kidney (B), heart (C) and lung (D) in cadmium-exposed rats. Blood TEF-1δ expression level showed positively correlation to the TEF-1δ levels in liver (r = 0.639, p < 0.01), kidney (r = 0.609, p < 0.01), heart (r = 0.651, p < 0.01) and lung (r = 0.628, p < 0.01).

