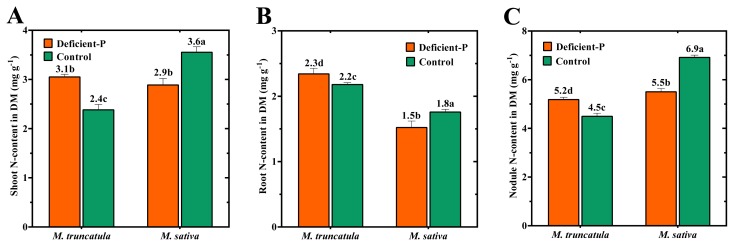
Figure 2.
N-content of (A) shoots, (B) roots and (C) nodules of M. truncatula and M. sativa inoculated with Sm2011 and grown over a period of 54 DAT in medium coarse sand supplemented with 100% (Control) or 5% (Deficient-P) of optimal P-level. Data are means of four replicates. Error bars represent standard errors. Data with different letters are significantly different as measured by Tukey’s test (p ≤ 0.05). DM, dry matter.

