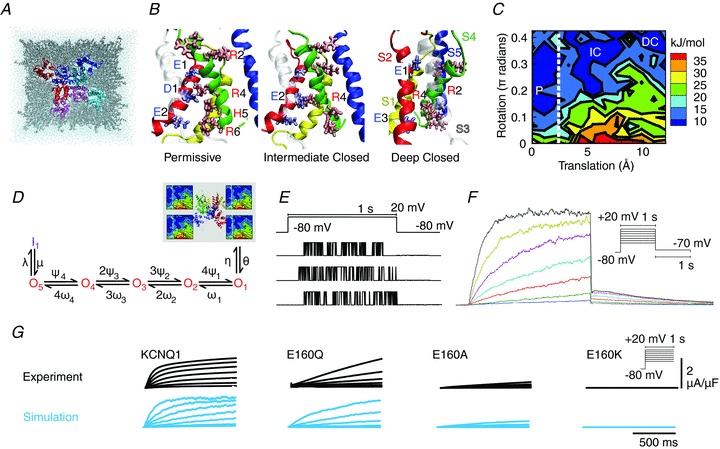
Figure 2. Bridging the genotype–phenotype gap with data and models at multiple phenotypic levels.

A, three-dimensional structure of KCNQ1 potassium channel, looking in from outside the cell. The channel consists of four subunits with six segments (colour-coded). Pore regions (S5–S6) of one subunit interact with the adjacent subunit voltage-sensing region (S1–S4). B, alternative metastable conformations of the subunits, only one of which permits ions to pass. C, energy landscape of conformations as characterized by translation and rotation of the S4 segment, shown here for transmembrane voltage Vm= 0 mV. Labels P, IC, DC refer to conformations in B. D, Markov model that simplifies the state space of the ion channel into discrete states. Only when all 4 subunits are in the permissive state (P) on the energy landscape, can the channel open (transition to O1) to generate current. E, recorded traces from single ion channels, showing stochastic switching between open and closed states. F, macroscopic current; the sum of 1000 single channels. Both individual traces and macroscopic current can be directly simulated from the Markov model. G, effects of mutation on macroscopic current, as observed and as simulated via protein conformation stability and the Markov model. Modified from Silva et al. (2009), with permission.
