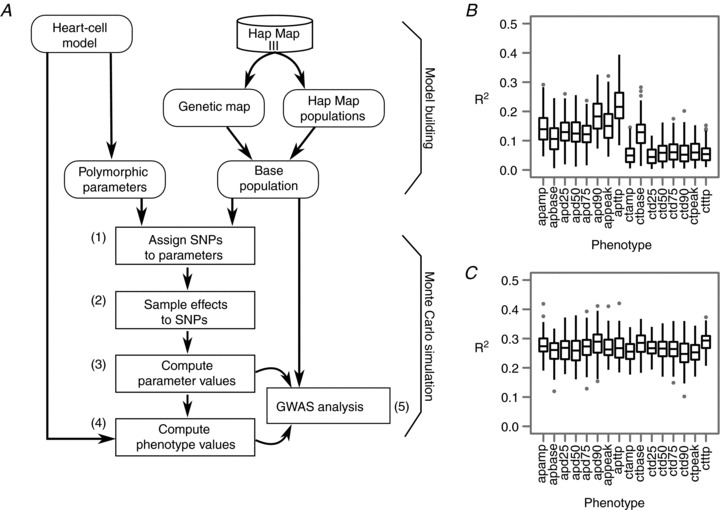
Figure 3. Virtual genome-wide association analysis, looking for DNA variation to predict phenotypic variation.

Targeting model parameters as intermediate phenotypes (C) proved more efficient than targeting top-level phenotypes alone (B). Panel A shows how a heart cell model, a genetic map and a virtual population are tied together by selecting heart model parameters assumed to be under the influence of genetic variation and associating the parameter variation to DNA variation (single nucleotide polymorphisms, SNPs) on virtual genomes. Individual genotypes are mapped into heart model parameters (steps 1–3), and by running the heart cell model parameters are mapped into cell-level phenotypes (step 4). Finally, GWAS analysis is then performed on the virtual population (step 5). (Fig. 1 of Wang et al. 2012). Panel B shows the variance in cellular phenotypes that could be explained using causal SNPs detected in GWAS targeting these phenotypes directly. Panel C shows improved results when using causal SNPs obtained from GWAS targeting all genetically controlled parameters. Each boxplot summarizes total explained variance by GWAS for 100 Monte Carlo runs. (Modified from Wang et al. 2012).
