
Figure 3. Normal morphology of the gastric mucosa in GFRα2-KO mice.
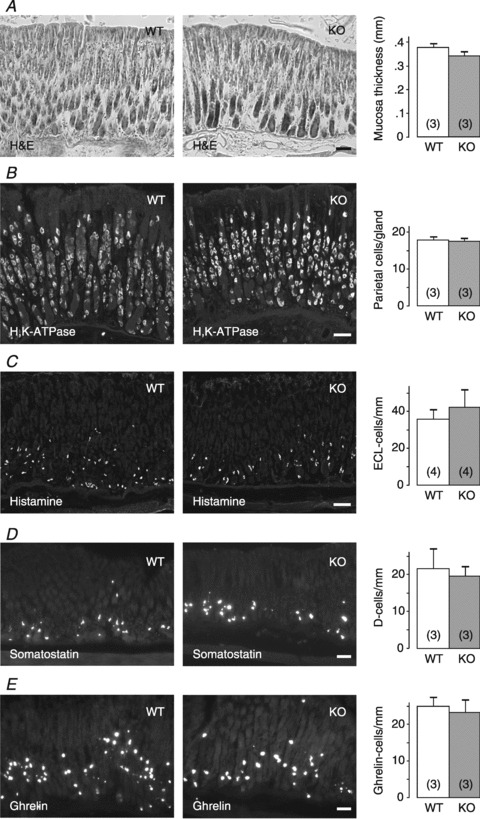
A, representative images of H&E-stained sections from wild-type (WT) and GFRα2-KO (KO) gastric mucosa (oxyntic part). Thickness of the mucosa is similar between the genotypes (P= 0.2). B–E, different cell types in the gastric mucosa were stained and quantified using antibodies for H+,K+-ATPase (B), histamine (C), somatostatin (D) and ghrelin (E): The distribution and density of the different cell types in the oxyntic mucosa is similar between the genotypes (P= 0.7–0.8). Number of animals per group is shown in parentheses. Scale bar: 50 μm.