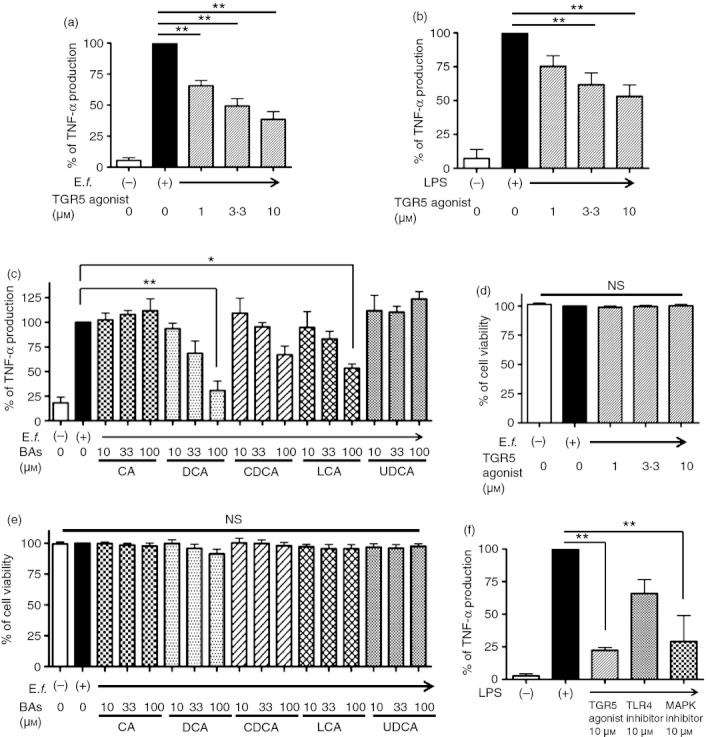
Figure 3.

A TGR5 agonist and bile acids (BAs) suppress tumour necrosis factor-α (TNF-α) production from macrophages differentiated with macrophage colony-stimulating factor (M-CSF) and interferon-γ (IFNγ) (Mγ-Mϕs) stimulated by Enterococcus faecalis or lipopolysaccharide (LPS). (a) The Mγ-Mϕs were differentiated from CD14+ monocytes with M-CSF and IFNγ; 50 and 100 ng/ml, respectively). After 6 days in culture, TNF-α levels in culture supernatants were analysed after 24 hr of stimulation with E. faecalis (multiplicity of infection = 100) with or without the TGR5 agonist (1, 3·3 and 10 μm). Results are shown as the means ± SEM from seven independent experiments as relative percentages of the TNF-α levels in Mγ-Mϕs stimulated with E. faecalis only. Statistical analysis was performed by Kruskal–Wallis one-way analysis of variance (anova) and the Bonferroni post-hoc test for multiple comparisons. **P < 0·01. (b) Similar TNF-α analysis to that in (a), stimulated with LPS (100 ng/ml) with or without the TGR5 agonist. Results are shown as the means ± SEM from five independent experiments as relative percentages of the TNF-α levels in Mγ-Mϕs stimulated with LPS only. Statistical analysis was performed by Kruskal–Wallis one-way anova and the Bonferroni post-hoc test for multiple comparisons. **P < 0·01. (c) Several BAs inhibited TNF-α production, which was promoted by E. faecalis (multiplicity of infection = 100) after 24 hr of stimulation, from Mγ-Mϕs on day 6. Results are shown as the means ± SEM from three independent experiments as relative percentages of the TNF-α levels in Mγ-Mϕs stimulated with E. faecalis only. Statistical analysis was performed by Kruskal–Wallis one-way anova and the Bonferroni post-hoc test for multiple comparisons. *P < 0·05, **P < 0·01. CA, cholic acid; DCA, deoxycholic acid; CDCA, chenodeoxycholic acid; LCA, lithocholic acid; UDCA, ursodeoxycholic acid; (d, e) Cell viability of peripheral blood mononuclear cell-derived Mγ-Mϕs. Mγ-Mϕs were differentiated from monocytes by 6 days of culture with M-CSF and IFNγ (control). Other stimuli were added on day 6; TGR5 agonist (1, 3·3 and 10 μm) in (d), and BAs including CA, DCA, CDCA, LCA and UDCA in (e). Cell viability was measured by PrestoBlue Cell Viability Reagent. Results are shown as the means ± SEM from each three independent experiments as relative percentages of the viability of Mγ-Mϕs stimulated with E. faecalis only. Statistical analysis was performed by Kruskal–Wallis one-way anova. (f) TNFα levels in Mγ-Mϕs culture supernatants were analysed after 24 hr stimulation with LPS (100 ng/ml) with or without the inflammatory agents as follows: TGR5 agonist, toll-like receptor (TLR) 4 inhibitor and p38 mitogen-activated protein kinase (MAPK) inhibitor. Results are shown as the means ± SEM from three independent experiments as relative percentages of TNFα levels in Mγ-Mϕs stimulated with LPS only. Statistical analysis was performed by Kruskal–Wallis one-way anova and the Bonferroni post-hoc test for multiple comparisons. **P < 0·01.
