Figure 1.

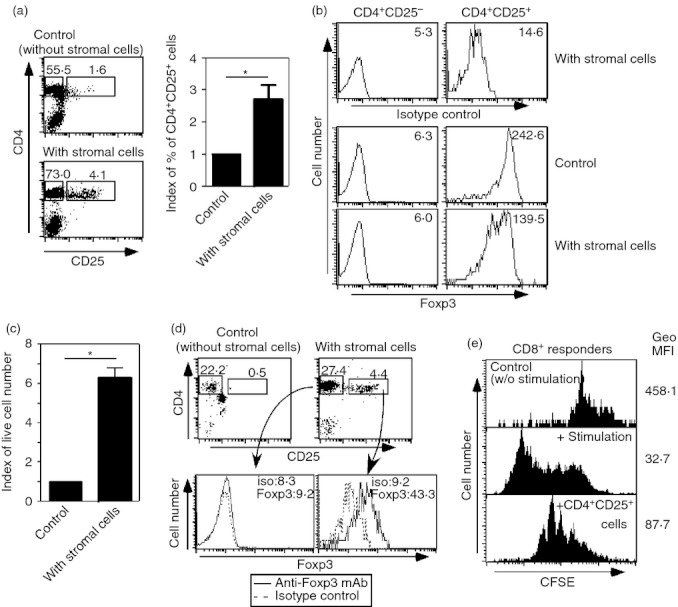
Stromal cells from peripheral lymphoid tissues support functional regulatory T (Treg) cells in vitro. (a, b) Lymph node cells were co-cultured with or without stromal cells in the absence of exogenous cytokines. Five days after culture, cells were harvested and expression levels of CD4, CD25 (a) and Foxp3 (b) were assessed. Index of proportion of CD4+ CD25+ cells are summarized by bar graphs (*P < 0·01, n = 8). (c) CD4+ CD25+ cells purified from lymph nodes and spleens were co-cultured with or without stromal cells in the absence of exogenous cytokines. Five days after culture, the numbers of live cells were counted. The index of live cell numbers was calculated. Cell numbers from control culture (without stromal cells) were assigned a value of one (*P < 0·01, n = 3). (d) CD4+ cells from spleen and lymph nodes were co-cultured with or without stromal cells. Fourteen days later, cells were harvested and expression levels of CD4, CD25 and Foxp3 were assessed. Expression levels of Foxp3 in CD4+ CD25+ T cells are depicted as histograms. (e) CD25+ cells were sorted from the co-culture with stromal cells depicted in (d). These CD25+ cells were added into mixed lymphocyte cultures (MLC), in which carboxyfluorescein succinimidyl ester (CFSE) -labelled responders were used. ‘Control’: CFSE-labelled cells were cultured without stimulators. ‘+ stimulation’: MLC where CFSE-labelled responders were used. ‘+ CD4+CD25+ cells’: MLC including sorted CD25+ cells. Geometric MFI (Geo MFI) in each panel is indicated. Five days after the MLC, the intensity of CFSE in CD8+ T cells was analysed. The data shown represent one of two separate experiments. Proportions of designated areas of dot-plots and MFI of histograms are indicated.
