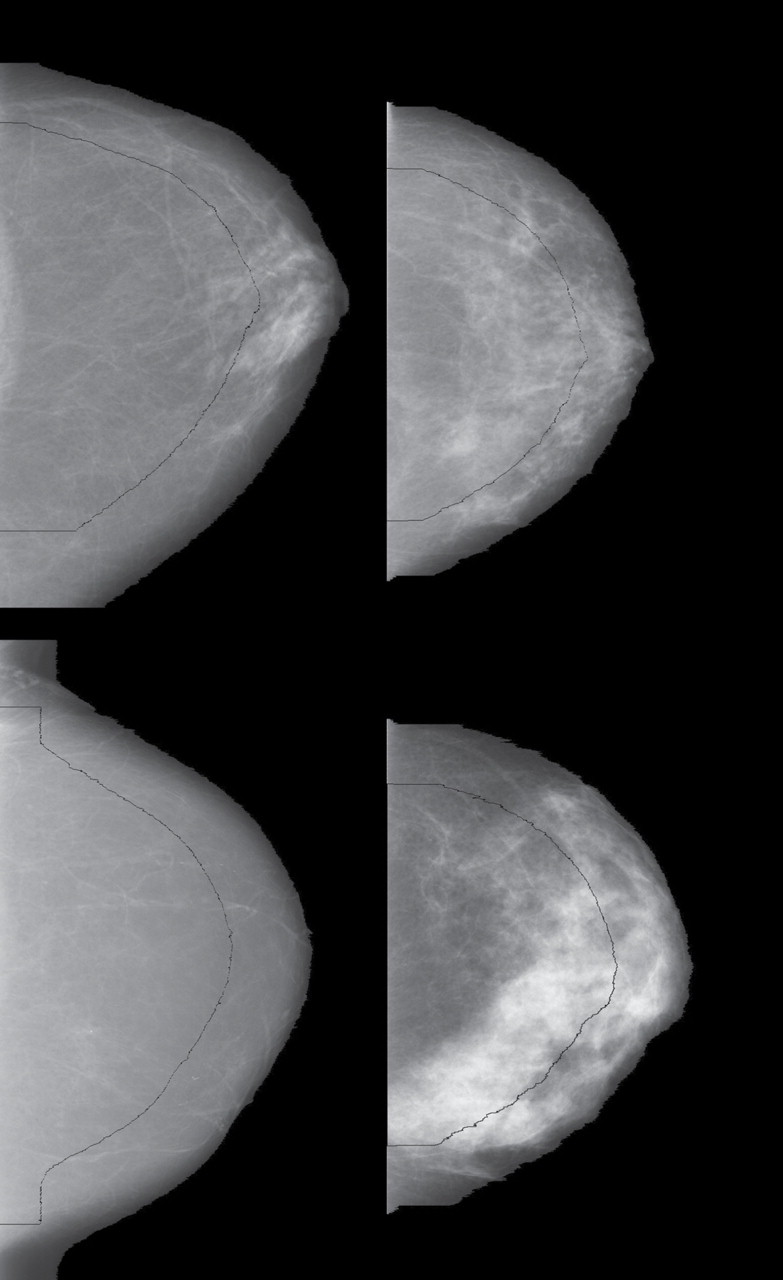
Figure 1.

Image processing examples of the variation measure (V) representing four combinations of the first (lowest) and fourth (highest) quartiles of variation and percent density (PD) distributions. Top left: first quartile V (V = 205) and first quartile PD (PD = 7%); top right: first quartile V (V = 208) and fourth quartile PD (PD = 44%); bottom left: fourth quartile V (V = 394) and first quartile PD (PD = 0%); bottom right: fourth quartile V (V = 571) and fourth quartile PD (PD = 42%). The breast is segmented from the background of the mammogram image. The curved black line indicates erosion of the breast by 25%. The variation measure is calculated using the pixels bound by this curved black line and the image border on the left.
