
Figure 2.
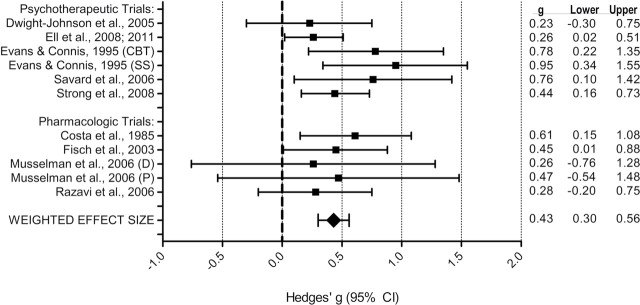
. Forest plot of effect sizes (Hedges’ g, designated g in the figure) for trials included in the meta-analysis (58–62,72–75). The corresponding 95% CI (designated “Lower” and “Upper” and indicated graphically by whisker bars) are also given. Effect sizes for the trials containing two intervention groups are displayed separately (59,62). CBT = cognitive behavioral therapy; CI = confidence interval; D = desipramine; P = paroxetine; SS = social support.