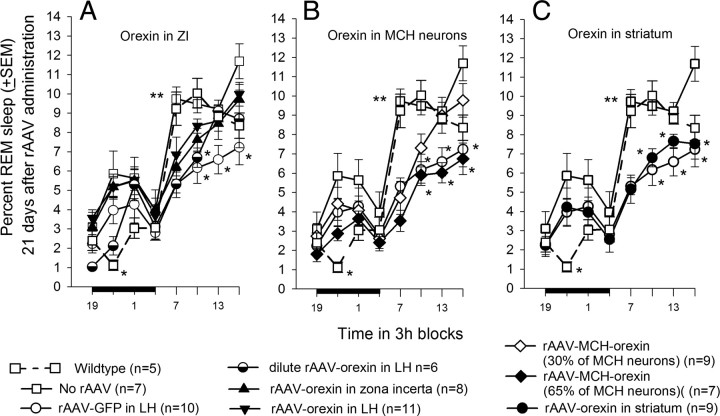
Figure 9.
Average (±SEM) percentage of REM sleep over 24 h in WT and orexin-ataxin-3 mice. The data for WT mice are given for comparison. The bar graphs in A–C summarize the average (±SEM) percentage of REM sleep during the 12 h day and night periods. One-way ANOVA followed by Dunnett's post hoc test, p < 0.05. *Compared with no-rAAV group; **no-rAAV versus all groups except WT.

