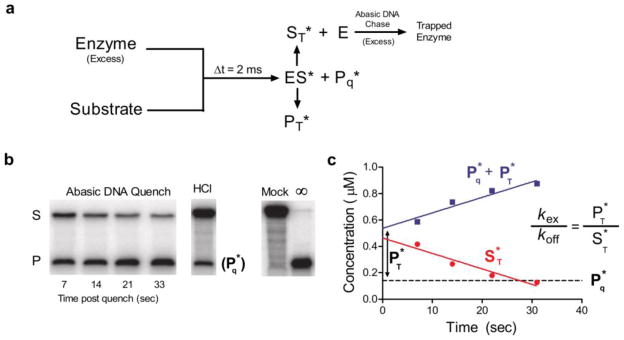
Figure 2.

Determination of the excision efficiency (E) for uracil cleavage by hUNG on ssDNA. (a) Rapid mixing scheme where hUNG (4 μM) was reacted with 1.0 or 0.5 μM 90mer DNA substrate containing a single uracil site (1XUss 90mer, Supplemental Methods. Both DNA concentrations gave identical results). After mixing, the reaction was either quenched with 0.5 M HCl or chased with 60 μM duplex DNA containing a tetrahydrofuran abasic site mimic (chDNA). Following the chase, the reaction mix was then manually quenched with HCl at the indicated times in panels b and c. (b) Separation of product and substrate bands by denaturing gel electrophoresis in the quenched and chased samples. Mock is a control reaction where the DNA was subjected to the exact processing procedure without the addition of enzyme. Note that the amount of trapped product at the time of chase mixing (PT*) must be obtained from Ptot by subtracting the amount of product already present within the 2 ms aging time as determined by the acid quenched samples. Thus, when 2 μM UNG was mixed with 1 μM substrate for 2 ms and the reaction was quenched with 0.5 M HCl, 0.13 ± 0.01 μM excision product was formed (P*q) and 0.86 ± 0.01 μM bound substrate was left unreacted (ES*). Linear extrapolation to zero time is used determine the amount of total product (Ptot = Pq* + PT*) formed and substrate (ST*) remaining at the time of addition of the chase DNA. (c) When the acid quench was replaced with 60 μM F containing DNA duplex (chDNA) to serve as a trap for hUNG after it dissociated from the ES* complex, the 0.86 μM ES* present at 2 ms was converted to 0.53 ± 0.08 μM free substrate (S*T), and 0.47 ± 0.08 μM was excised to form product (P*T). Because P*T/S*T = kex/koff = 0.34/0.53 = 0.64, then the average excision efficiency E = kex/(koff + kex) = PT*/(PT* + ST*) may be directly calculated as be 0.39 ± 0.14 from nine independent trials. Values are reported as the average ± 1 s.d. Control experiments varying the enzyme/substrate ratio as well as the chase DNA concentration gave identical results and are shown in Supplemental Fig. S2.
