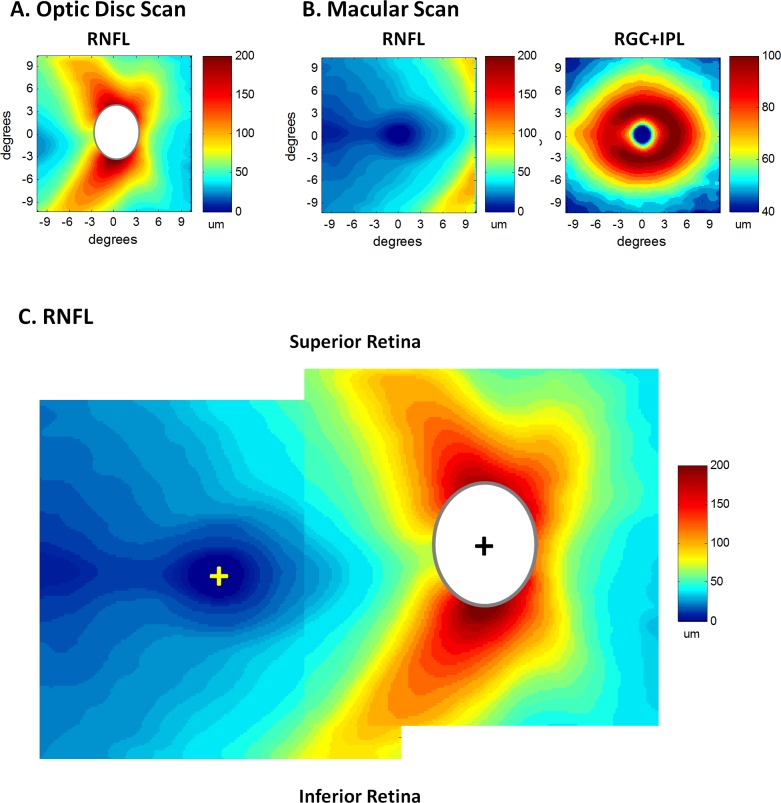
Figure 2.
(A) The average RNFL thickness map from the optic disc scans of the healthy control eyes. (B) The average RNFL (left) and RGC+IPL (right) thickness maps from the macular scans of the healthy control eyes. (C) The RNFL maps from panels A and B are superimposed by aligning the foveal (yellow +) and disc (black +) centers. Because disc sizes vary, the white ellipsoid masks the central region on the disc scan where data for at least 95% of the controls did not exist.

