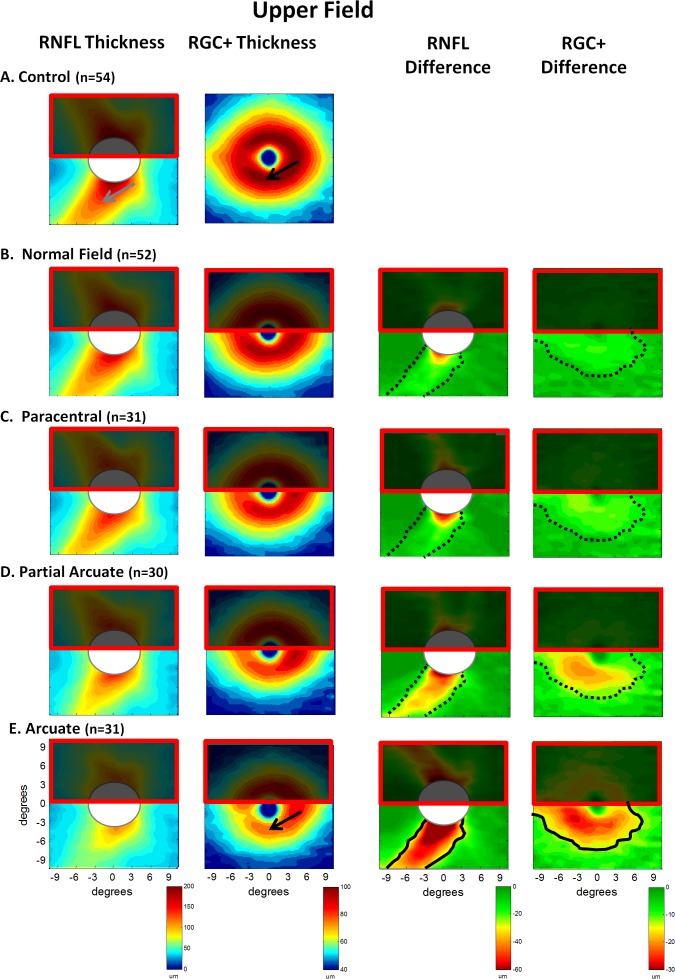
Figure 4. .
Results are shown for the healthy controls (A) and for the patients' eyes grouped according to classification of the superior visual field, normal (no damage) (B); paracentral defect (C); partial arcuate defect (D); and arcuate defect (E). The left two columns show the thickness maps of the RNFL of the disc scan and RGC+ IP layers of the macular scan. The right two columns are the difference maps produced by subtracting the thickness map of the controls from the thickness map of the patient group. The solid black curves in the left two panels of E are iso-thickness contours. These are superimposed on the panels above (dotted curves).

