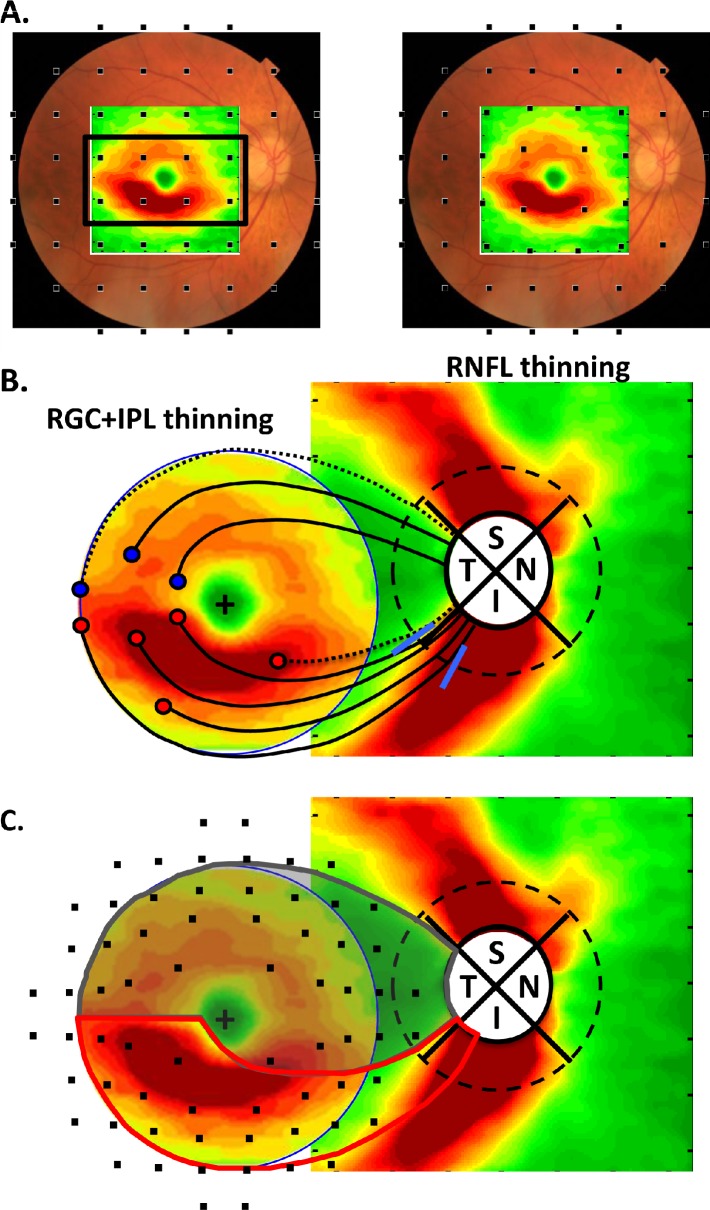
Figure 6. .
(A) The difference (thinning) plot for the RGC+ IP layers of the group with the MD < −5.5 dB from Figure 3D (rightmost panel) is shown with the test points of the 24-2. These points are positioned to coincide with the location of the RGC+IP layers activated as previously described.7,9 (B) The RGC+ IPL thinning map from A is combined with the RNFL thinning map for the same group. The dashed circle (diameter of 3.4 mm) is the locus of points used in most peripapillary scans. See text for details.

