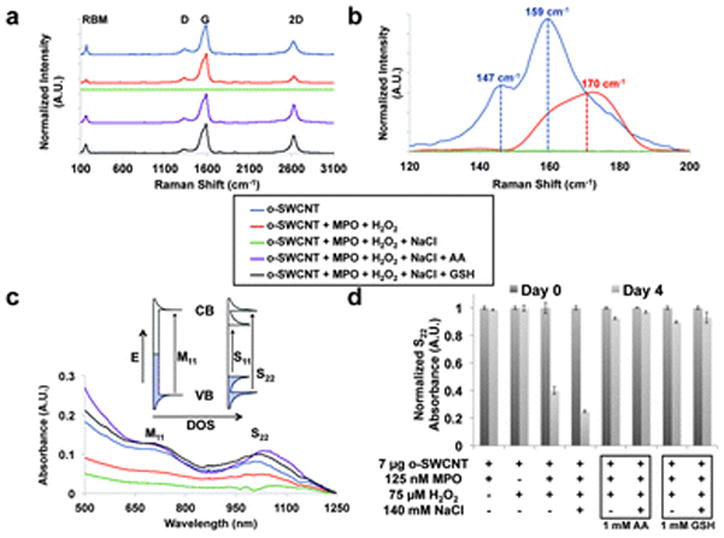
Fig 3.

(a) Raman spectroscopy performed on key o-SWCNTs samples (o-SWCNT: blue, o-SWCNT + MPO + H2O2: red, o-SWCNT + MPO + H2O2 + NaCl: green, o-SWCNT + MPO + H2O2 + NaCl + AA: violet, and o-SWCNT + MPO + H2O2 + NaCl + GSH: black) for 4 days under experimental conditions. The radial breathing mode (RBM), D, G, and 2D bands are identified. (b) The radial breathing mode (RBM) region of the Raman spectra. (c) Vis-NIR absorption spectra for o-SWCNTs samples identified in (a). The inset depicts the density of states (DOS) diagrams for metallic (left) and semiconducting (right) SWCNTs in which the optical transitions arising from van Hove singularities. The S22 and M11 transitions are identified on the spectra. (d) The S22 absorption intensity of o-SWCNTs at day 0 and day 4 for the given experimental conditions. This data was obtained from a microplate reader, and the error bar represents standard error of the mean with a sample size of three.
