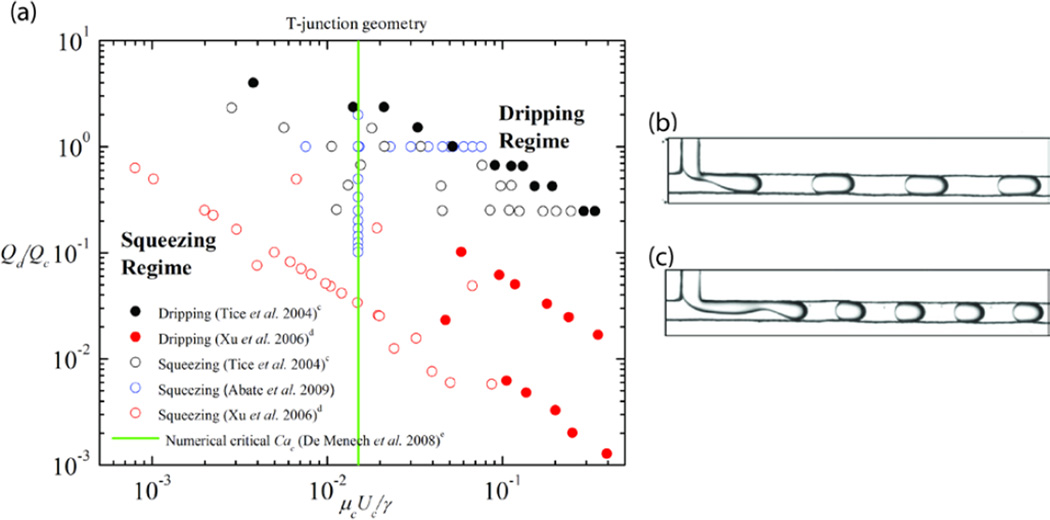
Figure 4.
(A) Phase diagram for microfluidic T-junction geometry, comparing data from Tice et al. (modified from [82]. Copyright 2004, with permission from Elsevier), Xu et al. (modified with permission from [85]. Copyright 2006 Wiley-VCH), and Abate et al. (modified with permission from [21]. Copyright 2009 by the American Physical Society), and examples of observed flow patterns (B) in the squeezing regime and (C) in the dripping regime of the phase diagram ((B–C) adapted from [82]. Copyright 2004, with permission from Elsevier).
c Data from [82] used so that viscosity ratio is 1. The capillary number of the continuous phase is calculated using data from [82].
d We assume the squeezing-to-dripping transition occurs when the average drop size becomes less than the width of the microchannel, and the scaling of the drop size with the capillary number abruptly changes.
e Numerical data obtained from [90].

