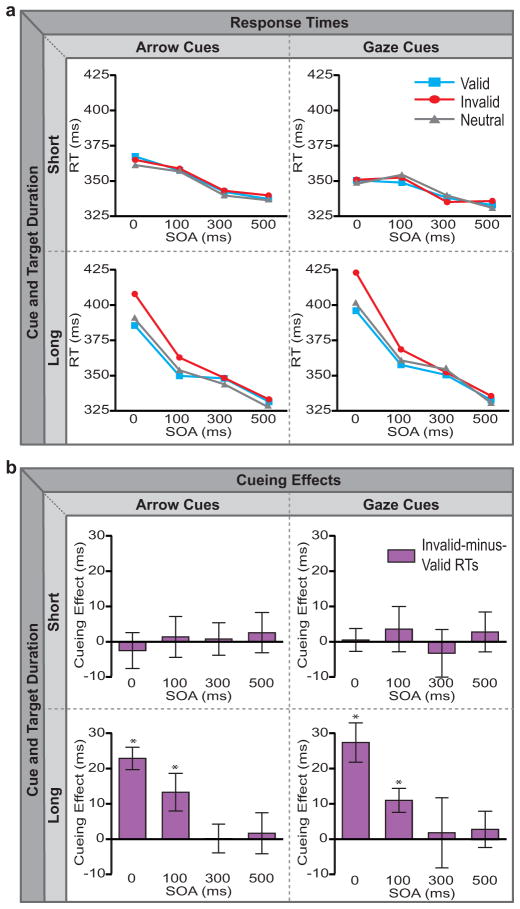
Figure 3.
Mean response times (a) and cueing effects (b) plotted as a function of SOA for arrow cues (left column) and gaze cues (right column), under both short-duration (top row) and long-duration (bottom row) conditions. Line graphs in panel (a) display mean RTs for validly, invalidly, and neutrally cued targets. Bar graphs in panel (b) depict the cueing effect (invalid-minus-valid RTs). The pattern of results corresponds to that predicted by a cue-target conflict explanation rather than by a rapid attentional orienting one (compare Fig. 3b to Fig. 1b/1c).

