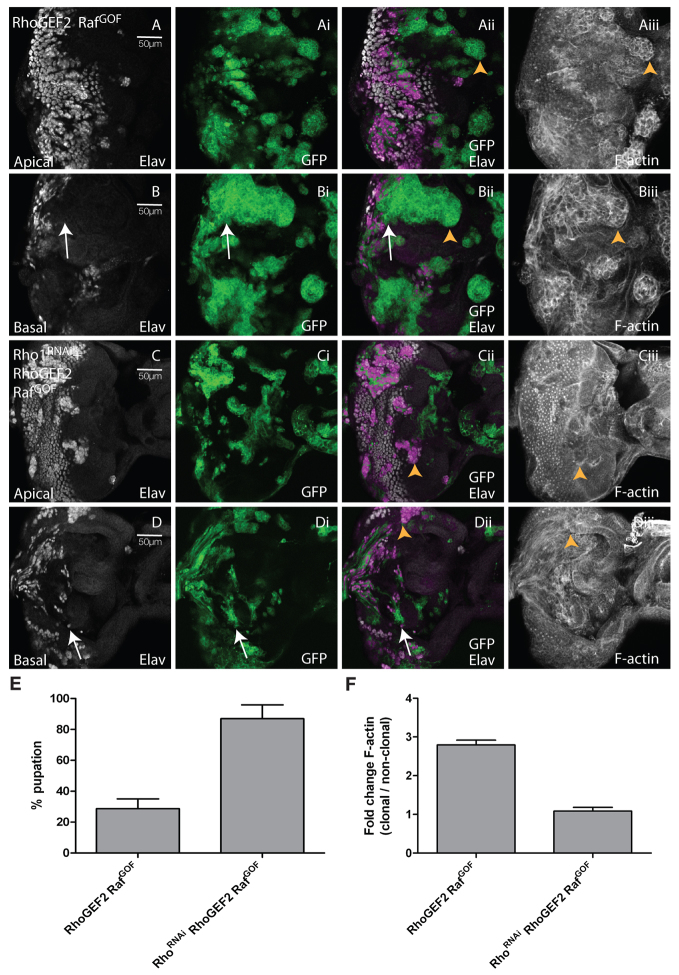
Fig. 2.
Reducing levels of Rho1 suppressed clonal tissue overgrowth, differentiation, and cell morphology defects, and rescued pupation in RhoGEF2 + RafGOF EADs. Confocal planar sections through the epithelium of third instar larval EADs. Apical (A,C) and basal (B,D) sections are shown. Mutant tissue was marked by the expression of GFP (green). EADs were stained for Elav (white) and with phalloidin-TRITC for F-actin (white). (A,B) RhoGEF2 + RafGOF. (C,D) Rho1RNAi+RhoGEF2 + RafGOF. Many RhoGEF2 + RafGOF-expressing cells in the posterior region do not stain with Elav, especially in the basal sections of the eye disc, where clonal tissue accumulated (arrows, B-Bii). F-actin was enriched in RhoGEF2 + RafGOF-expressing cells, particularly in basal sections (arrowheads, Aii,Aiii,Bii,Biii). Reducing levels of Rho1 in RhoGEF2 + RafGOF-expressing cells reduced the accumulation of undifferentiated clonal tissue (compare B-Bii with D-Dii, arrows) and reduced F-actin levels (arrowheads, Cii,Ciii,Dii,Diii) compared with RhoGEF2 + RafGOF mosaic EADs (Aii,Aiii,Bii,Biii, arrowheads). (E) Depletion of Rho1 in RhoGEF2 + RafGOF mosaic larvae resulted in increased pupation compared with RhoGEF2 + RafGOF mosaic larvae. The data was compared by a t-test and error bars represent s.e.m. The significance was P<0.0001. (F) Quantification of F-actin levels in RhoGEF2 + RafGOF or RhoGEF2 + RafGOF + Rho1RNAi clones versus wild-type clones. The data was compared by a t-test and error bars represent s.e.m. The significance was P<0.0001 for RhoGEF2 + RafGOF + Rho1RNAi versus RhoGEF2 + RafGOF.

