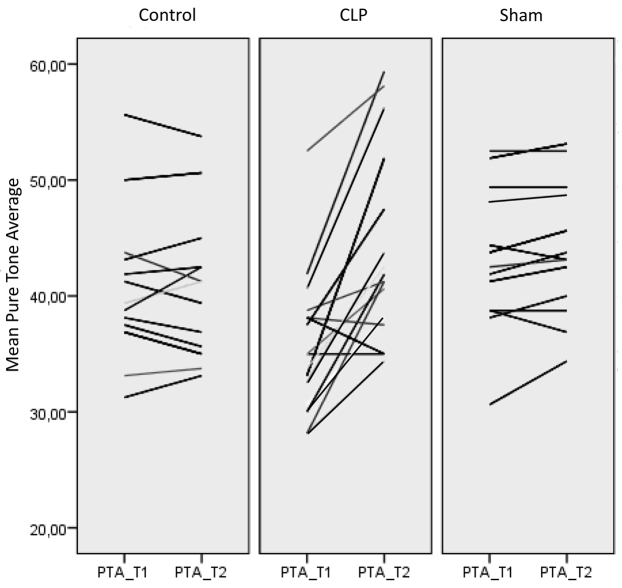
Fig. 1.
Spaghetti plot of the audiological results for the control, CLP and the sham group. All audiological results were averaged at the time-point of inclusion as pure tone average 1 (PTA_T1). The audiological results at the time-point of sacrifice were averaged as pure tone average 2 (PTA_T2). Each line in the graph stands for one individual, connecting PTA_T1 and PTA_T2. A horizontal line, as seen in the control and the sham group, indicates no hearing loss; a steep line indicates a change in the hearing threshold between the first and second measurements.

