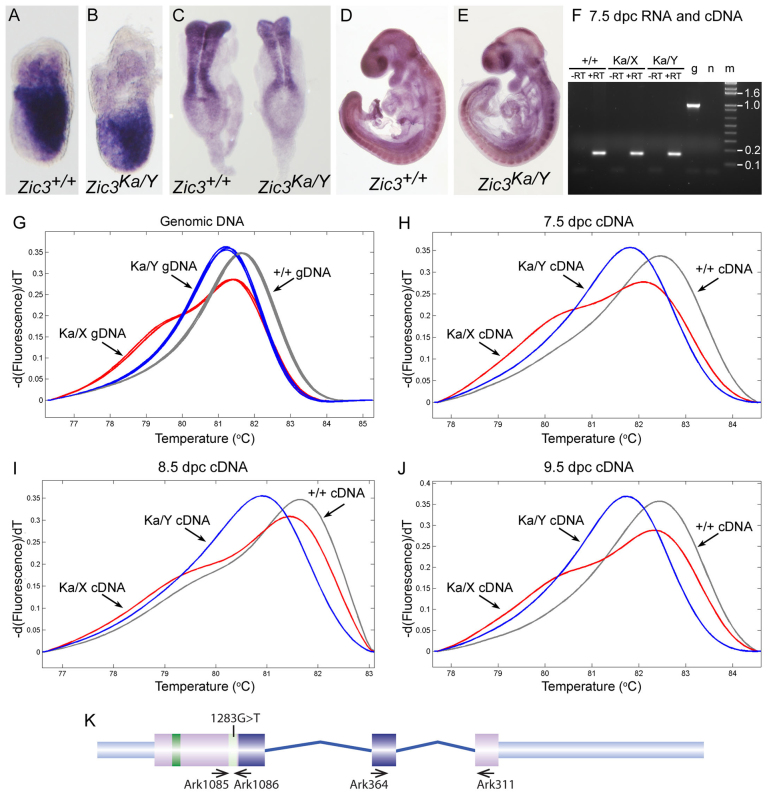
Fig. 2.
The katun PTC-containing transcript accumulates in gastrulation and organogenesis stage mutant embryos. (A–E) Lateral views of embryos after WMISH to Zic3 RNA; embryos are shown with anterior to the left (A,B,D,E) or top (C). (A,B) 7.0 dpc embryos of the genotype indicated on the panel. (C) 8.5 dpc embryos of the genotype indicated on the panel. (D,E) 9.5 dpc embryos of the genotype indicated on the panel. (F) PCR amplification of an intron-spanning product from the Zic3 gene (generated with primers Ark364 and Ark311; expected product size for genomic DNA is 1006 bp and for cDNA is 162 bp) following cDNA synthesis from each of the RNAs used for allele-specific PCR. –RT, without reverse transcriptase; +RT, with reverse transcriptase; g, genomic DNA; n, no template control; m, size marker. (G–J) Melting peak analysis following high resolution melting of Zic3 allele-specific PCR products (generated with primers Ark1085 and Ark1086). The Zic3+/+ DNA melt profiles are shown in gray, the Zic3Ka/Y DNA melt profiles in blue and the Zic3Ka/X profiles in red. (G) Zic3 amplicons after PCR of genomic DNA isolated from three Zic3+/+ mice, three Zic3Ka/X mice or three Zic3Ka/Y mice. (H) Zic3 amplicons after PCR of cDNAs synthesized from 7.5 dpc RNA. (I) Zic3 amplicons after PCR of cDNAs synthesized from 8.5 dpc RNA. (J) Zic3 amplicons after PCR of cDNAs synthesized from 9.5 dpc RNA. (K) Diagram of the murine Zic3 genomic locus showing the location of the mutation and the primers used for allele-specific and intron-spanning RT-PCR.

