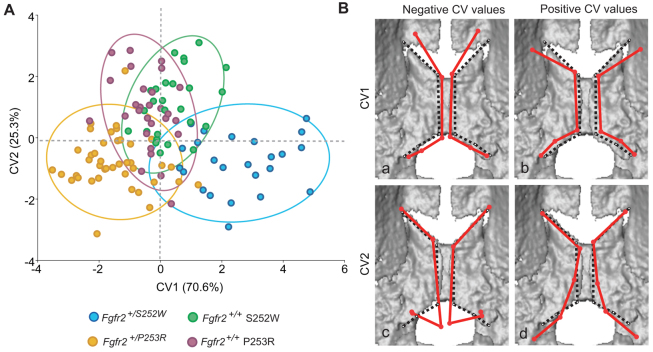
Fig. 2.
Canonical variates analysis. (A) Scatterplot corresponding to the first two canonical variates (CV1 and CV2). Ellipses account for 90% of within-group variation. Fgfr2+/S252W Apert syndrome mice (extreme positive CV1 values) show a greater range of variation and include those cases representing the most extreme variation of the sample. (B) Shape changes (shown as wireframes) associated with extreme positive and negative values of CV1 and CV2 after adjusting for allometry superimposed on 3D μCT surface reconstructions of the newborn mouse palate. Shape changes associated with CV values are represented by solid red wireframes. Black dotted wireframes represent the palatine morphology of the mean shape. (Ba) Negative values of CV1 (Fgfr2+/P253R); (Bb) positive values of CV1 (Fgfr2+/S252W); (Bc) negative values of CV2 (Fgfr2+/S252W and Fgfr2+/P253R Apert syndrome mice); (Bd) positive values of CV2 (Fgfr2+/+ unaffected littermates).

