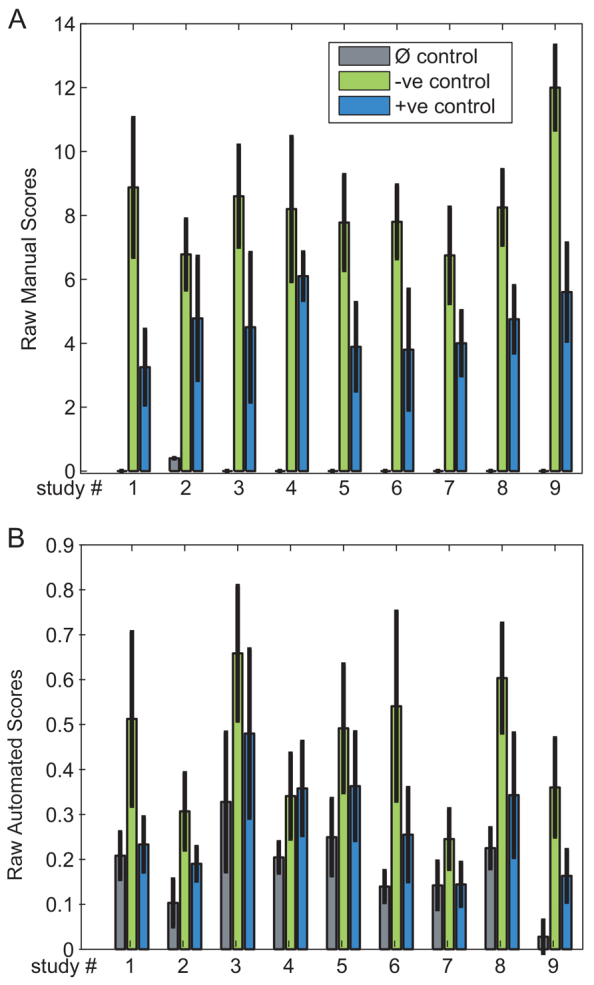
Fig. 1.

Evaluation of raw scores of control groups in historical studies. The mean and standard deviations of the manual (A) and automated (B) raw scores for equivalent (Ø, −ve and +ve) control groups in each study. The bars indicate the mean score within the group, whereas the error bars indicate 1 s.d. The mean score across all studies for the Ø control groups divided by the mean score of the animals in each corresponding −ve control group is 0.005±0.016 (manual) and 0.430±0.098 (automated). The corresponding values for the −ve control group are 1±0.186 (manual) and 1±0.178 (automated). Finally, within the +ve control group, the corresponding values are 0.506±0.088 (manual) and 0.584±0.160 (automated). The relatively large s.d. of mean scores from equivalent control groups suggest that the raw scores from different studies need to be normalized in order to be comparable.
