Figure 4.
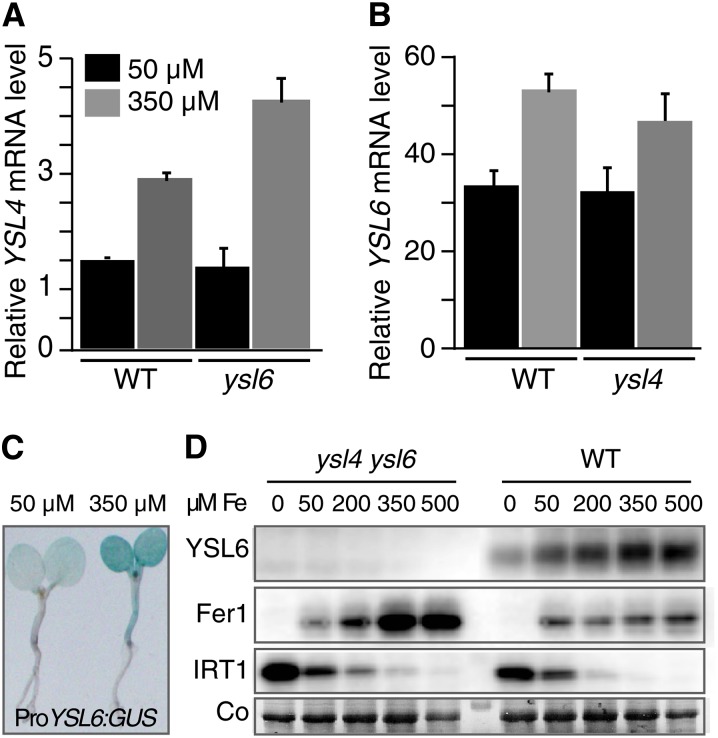
Regulation of YSL4 and YSL6 Expression by Iron.
(A) and (B) Relative YSL4 and YSL6 transcripts abundance determined by real-time RT-PCR in 5-d-old plants grown in iron-replete (50 µM Fe) or iron-excess (350 µM Fe) conditions. Mean values represent triplicates from two independent experiments. Error bars represent sd. WT, the wild type.
(A) YSL4 transcript level measured in wild-type or ysl6 plants showing deregulation of YSL4 in the ysl6 mutant.
(B) YSL6 transcript level measured in wild-type or ysl4 plants.
(C) Elevated iron concentration activates YSL6 promoter; 5-d-old transgenic lines expressing ProYSL6:GUS grown as in (A) and (B), were stained for GUS activity.
(D) Immunoblot analysis of YSL6 level in 5-d-old plants challenged with a range of iron concentrations. Ferritin (Fer1) and the iron transporter IRT1 are used as controls for iron overload and iron deficiency, respectively. Co, Coomassie blue staining
[See online article for color version of this figure.]

