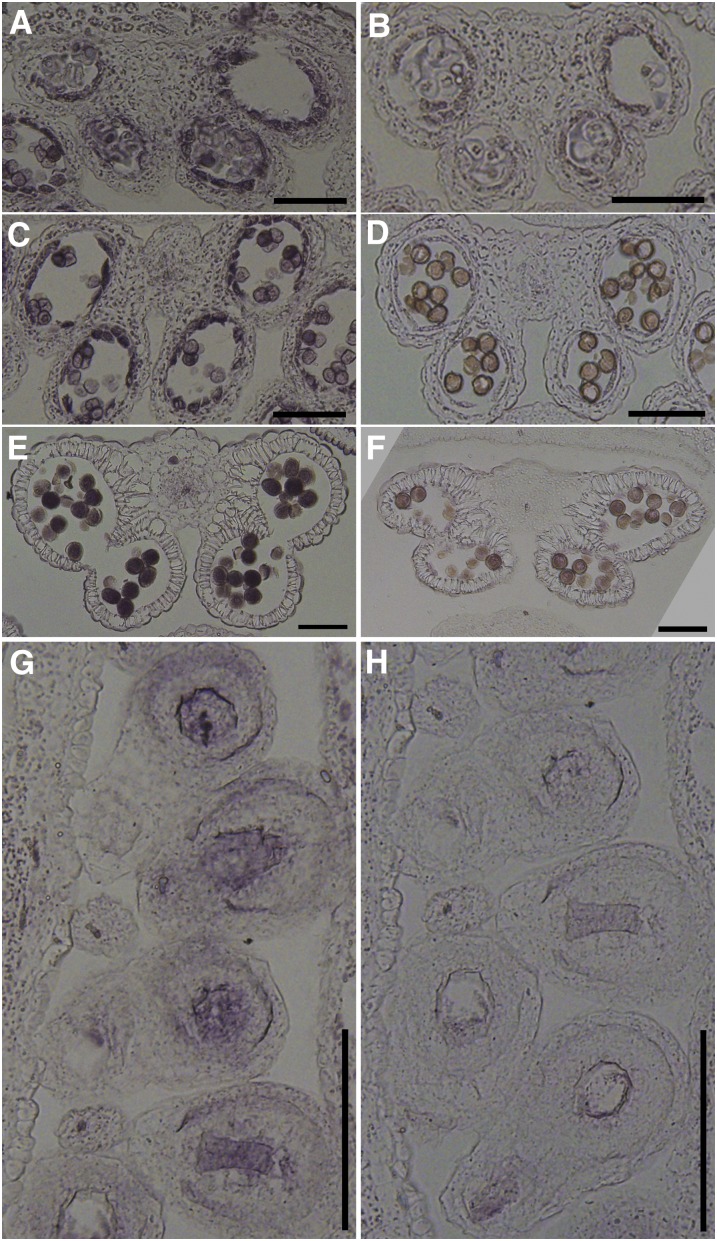
Figure 6.
Expression of PAT10 in Tapetum, Pollen, and Developing Ovules by RNA in Situ Hybridization Analysis.
(A) and (B) A stage 6 wild-type anther labeled by the antisense probe (A) or the sense probe (B). The tapetal layer shows strong signal.
(C) and (D) A stage 9 wild-type anther labeled by the antisense probe (C) or the sense probe (D). Strong signal is not only detected at the tapetal layer but also in developing pollen.
(E) and (F) A stage 12 wild-type anther labeled by the antisense probe (E) or the sense probe (F). The tapetal layer is fully degenerated. Strong signals are present in mature pollen.
(G) and (H) Longitudinal sections of unfertilized mature pistils from wild-type plants labeled by the antisense probe (G) or the sense probe (H). Strong signals are present at the embryo sacs and its surrounding cells.
Bars = 100 µm.

