Figure 7.
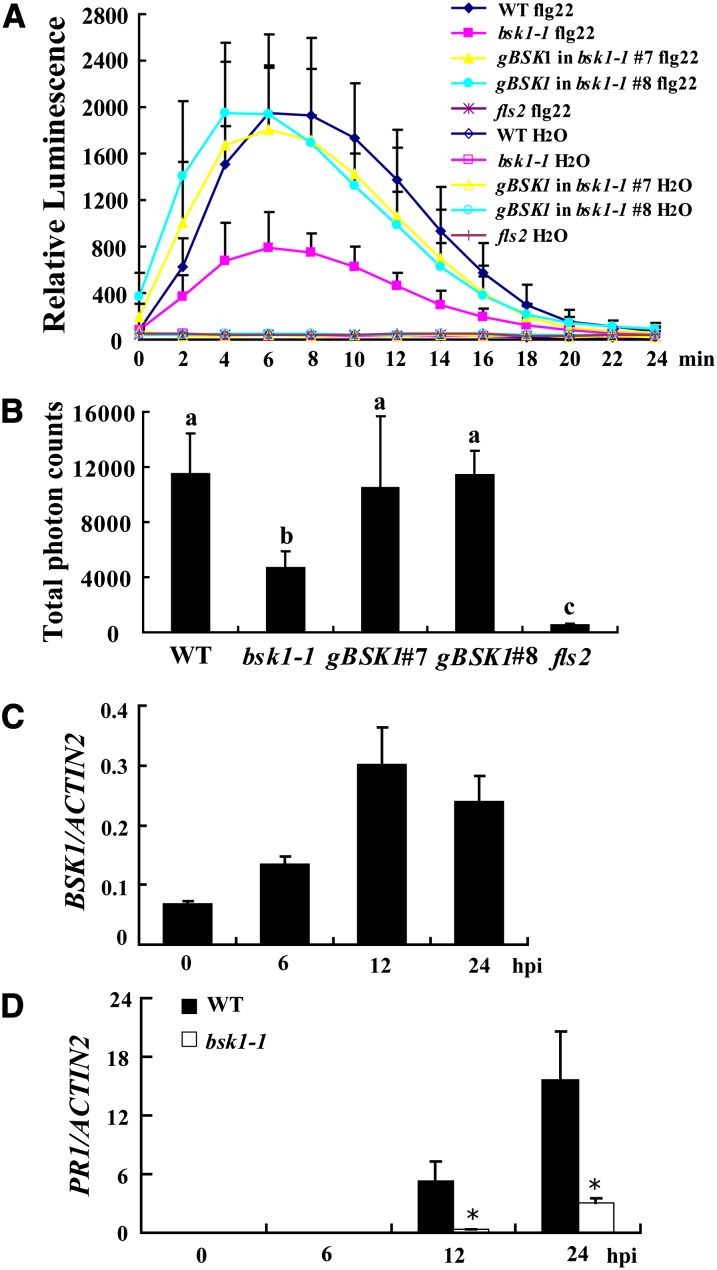
bsk1-1 Displayed Defects in flg22-Induced ROS Burst.
(A) Leaves of the wild type, bsk1-1, fls2, and two bsk1-1 complementation lines were treated with 100 nM flg22 and incubated with luminol and horseradish peroxidase to detect ROS. Luminescence was recorded at different time points as indicated. Error bars represent sd of data derived from replicate samples (n = 12). WT, the wild type.
(B) Total photon counts during 30 min of treatment are presented to indicate the ROS production. Bars represent sd (n = 12). Statistically significant differences were indicated with lowercase letters (P < 0.01, one-way ANOVA).
(C) Accumulation of BSK1 transcript in response to flg22. The wild-type seedlings were treated with 100 nM flg22 at different time points. hpi, h after infection.
(D) The transcript accumulation of PR1 was examined by quantitative real-time PCR at various time points after treatment with 100 nM flg22. ACTIN2 was used as an internal control. Bars represent mean and sd from three independent experiments. Statistically significant difference is indicated by an asterisk (P < 0.05, Student’s t test).
The experiments were repeated three times with similar results.

