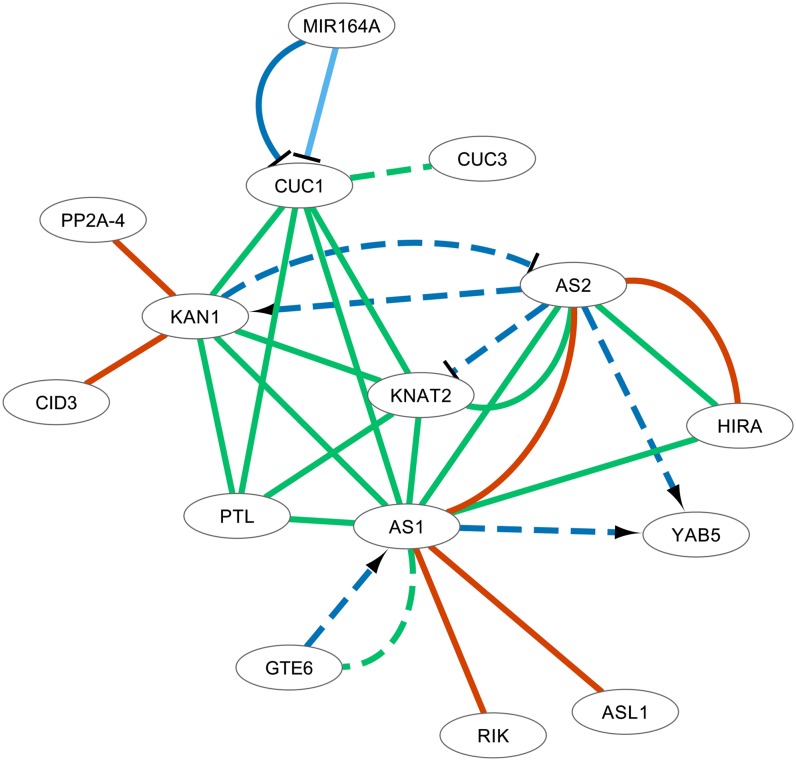
Figure 6.
Integrated Network of Organ Polarity Genes.
This cluster contains a number of edges that were identified with a confidence level lower than −0.7 (dashed edges), which are discussed in the text. Visual properties of the network are as in Figure 3.

