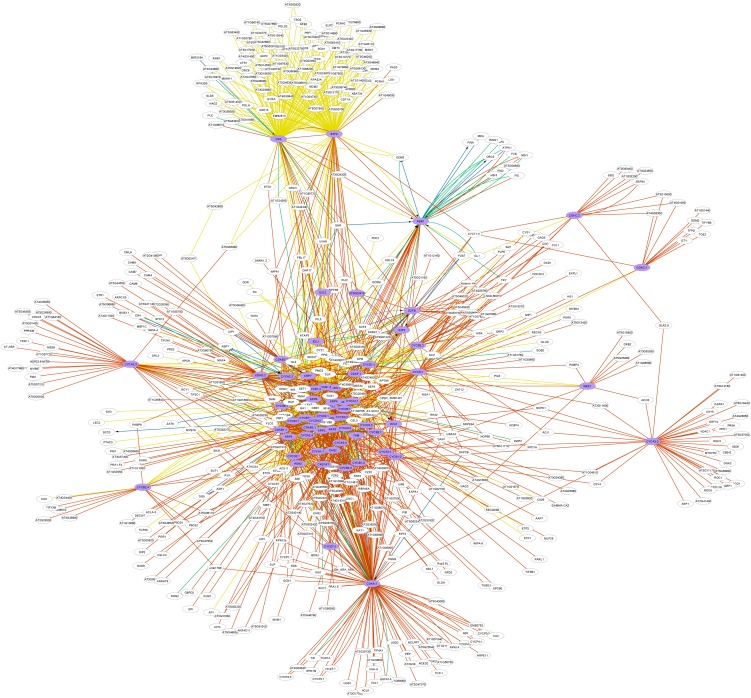
Figure 7.
Integrated Network of the 61 Core CC Genes (Depicted in Purple) and Their Direct Associations.
Visual properties of the network are as in Figure 3. Self-regulation and homodimerization were removed from the network figure, as we aimed to elucidate the interplay between the different CC genes and putative interactors, regulators, or targets.

